

Question: U U A wvm.instructure.com 6.1-6.2 Math 10 MWF Lecture T Question - TestNav D Question 3 The critic scores for a large sample of video

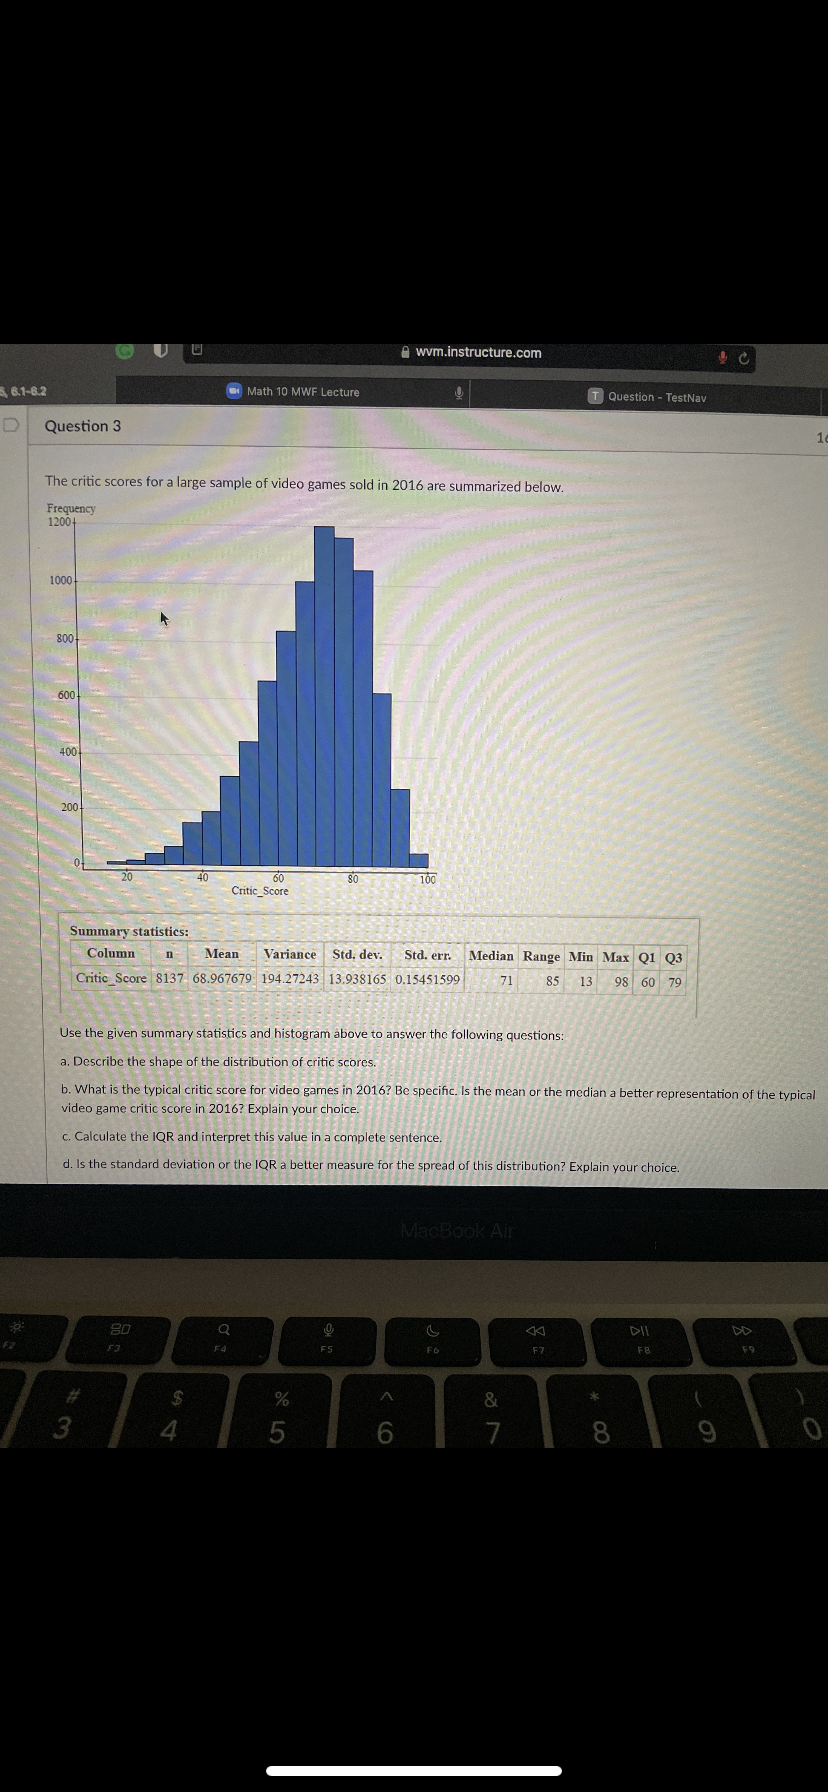
U U A wvm.instructure.com 6.1-6.2 Math 10 MWF Lecture T Question - TestNav D Question 3 The critic scores for a large sample of video games sold in 2016 are summarized below. Frequency 1200+ 1000 800 600 400 200 40 60 80 100 Critic_Score Summary statistics: Column n _Mean Variance Std. dev. Std. err. Median Range Min Max Q1 Q3 Critic_Score 8137 68.967679 194.27243 13,938165 0.15451599 71 85 13 98 60 79 Use the given summary statistics and histogram above to answer the following questions: a. Describe the shape of the distribution of critic scores. b. What is the typical critic score for video games in 2016? Be specific. Is the mean or the median a better representation of the typical video game critic score in 2016? Explain your choice. c. Calculate the IQR and interpret this value in a complete sentence. d. Is the standard deviation or the IQR a better measure for the spread of this distribution? Explain your choice. MacBook Air 80 Q U DII DD F2 ES F6 F7 FB F9 % 5 6 O
Step by Step Solution
There are 3 Steps involved in it

Get step-by-step solutions from verified subject matter experts