

Question: (UCLr) Refer to Table 56.1Factor for Computing Control Chart Limits3.a) for this problem Twelve samples, each containing five parts, were taken from a process that
(UCLr) 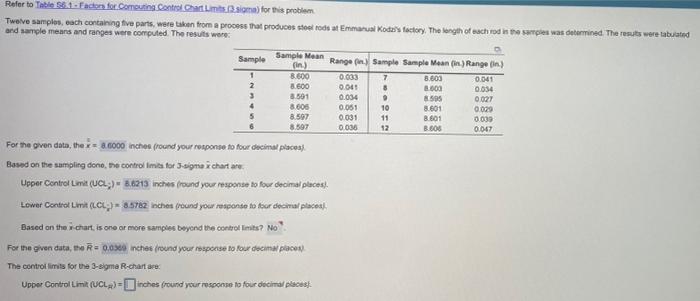
Refer to Table 56.1Factor for Computing Control Chart Limits3.a) for this problem Twelve samples, each containing five parts, were taken from a process that produces stoel rods at Emmanuel Koda's factory. The length of each rod in the samples was determined. The results were tabulated and sample means and ranges were computed. The results were Sample Sample Mean fin.) Range Sample Sample Mean (1) Range(n) 1 8.600 0.003 7 8.803 0.041 2 8.600 0.04 8 8.600 0.654 3 3.591 0,034 . 8.505 0.027 4 8.606 0.051 10 8.601 0.029 5 8.597 0.031 11 8801 0.039 8.597 0.035 12 3.600 0.047 For the given data, ther= 3.6000 inches fround your response to four decimal places) Based on the sampling done, the controllimits for 3-signa i chart are Upper Control Lime (UCL ;) - 5.8213 inches (round your response to four four decimal places Lower Control Lima (LC85782 inches (round your response to door de mal placed Based on the chart, is one or more samples beyond the controllimits? No? For the given data, the R = 0.034 inches (round your response to four decimal place) The controllimis for the 3-sigma R-chartare Upper Control Limit (UCLA) = inches fround your response to four decimal places
Step by Step Solution
There are 3 Steps involved in it
1 Expert Approved Answer
Step: 1 Unlock

Question Has Been Solved by an Expert!
Get step-by-step solutions from verified subject matter experts
Step: 2 Unlock
Step: 3 Unlock