

Question: ue No Due Date Points 0 Submitting an external tool Intro The following table shows historical beginning-of-year prices for two stocks. B 1 Year Stock
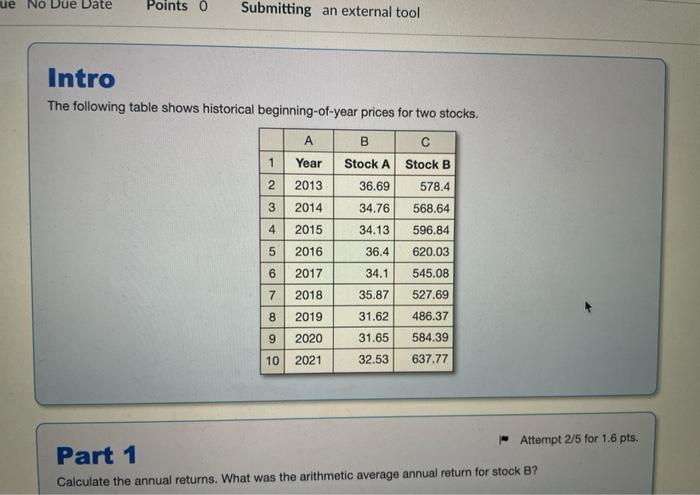
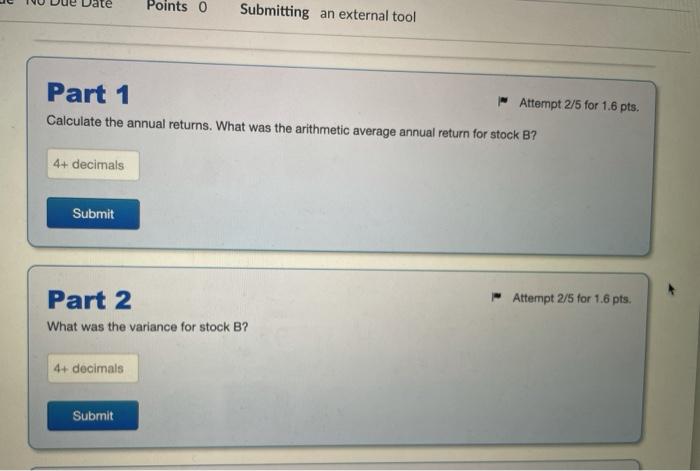
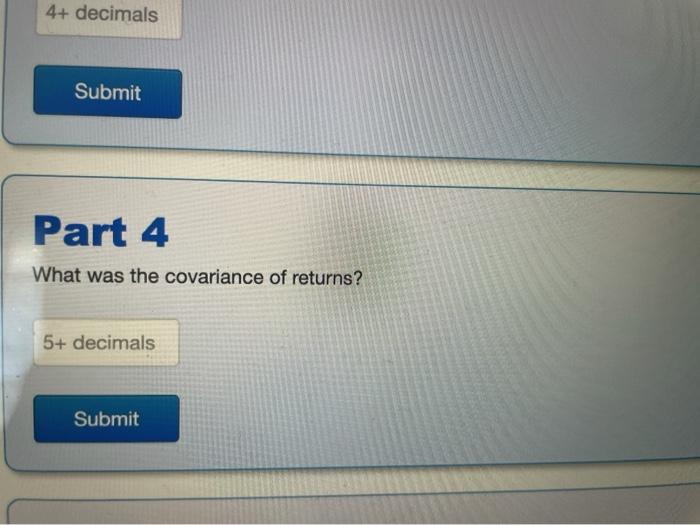
ue No Due Date Points 0 Submitting an external tool Intro The following table shows historical beginning-of-year prices for two stocks. B 1 Year Stock A Stock B 2 2013 36.69 578.4 3 2014 34.76 568.64 4 2015 34.13 596.84 5 2016 36.4 620.03 6 2017 34.1 545.08 527.69 7 2018 35.87 8 486.37 2019 2020 9 31.62 31.65 32.53 584.39 637.77 10 2021 Part 1 Attempt 2/5 for 1.6 pts. Calculate the annual returns. What was the arithmetic average annual return for stock B? Points 0 Submitting an external tool Part 1 - Attempt 2/5 for 1.6 pts. Calculate the annual returns. What was the arithmetic average annual return for stock B? 4+ decimals Submit Attempt 2/5 for 1.6 pts. Part 2 What was the variance for stock B? 4+ decimals Submit 4+ decimals Submit Part 4 What was the covariance of returns? 5+ decimals Submit
Step by Step Solution
There are 3 Steps involved in it

Get step-by-step solutions from verified subject matter experts