

Question: uestion 6 ( 2 0 pts ) Using the data below, which represent the measured temperatures of a metal rod under varying heat inputs, perform
uestion pts Using the data below, which represent the measured temperatures of a metal rod under varying heat inputs, perform the following tasks: a a Calculate the leastsquares estimates of the thermal response constant and the initial temperature of the metal rod. b b Write the equation of the leastsquares line. Note: Provide detailed hand calculations and compare with the Excel results. c c Compute the coefficient of determination RNote: Provide a graph to be plotted only by Excel. Question pts
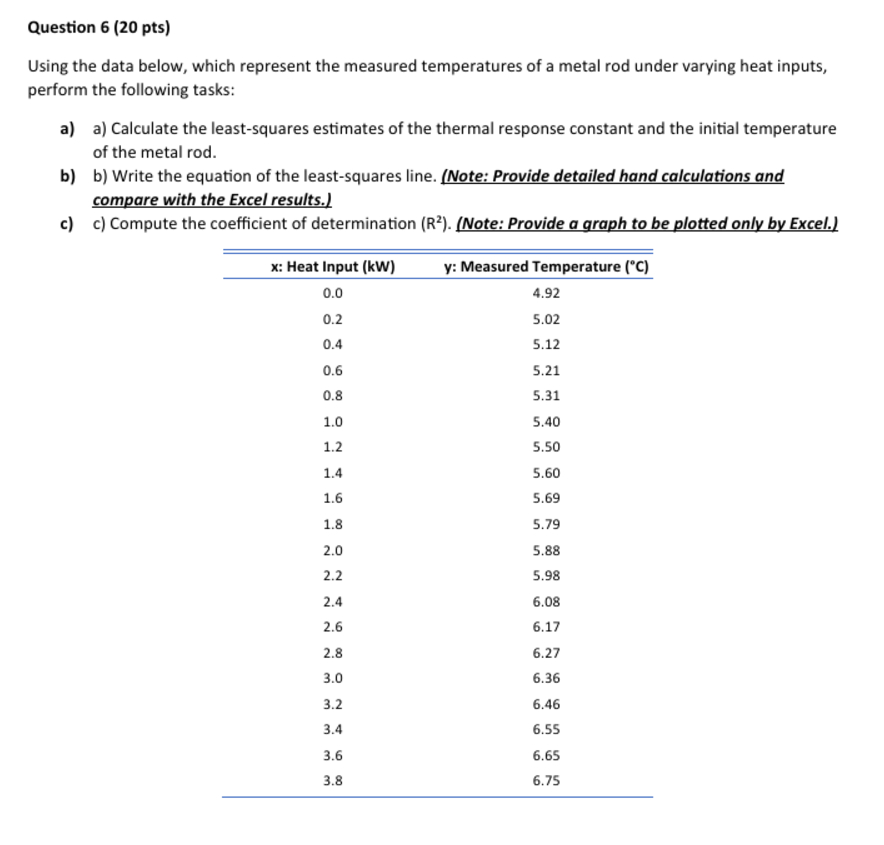
Using the data below, which represent the measured temperatures of a metal rod under varying heat inputs, perform the following tasks:
a a Calculate the leastsquares estimates of the thermal response constant and the initial temperature of the metal rod.
b b Write the equation of the leastsquares line. Note: Provide detailed hand calculations and compare with the Excel results.I
c c Compute the coefficient of determination mathrmRNote: Provide a graph to be plotted only by Excel.
Step by Step Solution
There are 3 Steps involved in it
1 Expert Approved Answer
Step: 1 Unlock

Question Has Been Solved by an Expert!
Get step-by-step solutions from verified subject matter experts
Step: 2 Unlock
Step: 3 Unlock