

Question: undefined 2. The following data provided (classdata.xlsx) was obtained from 10 iterations made by a structural engineer to understand the ability of a rectangular beam
 undefined
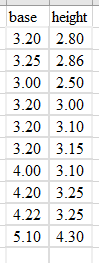
2. The following data provided (classdata.xlsx) was obtained from 10 iterations made by a structural engineer to understand the ability of a rectangular beam section to resist bending in the x-axis by determining its moment of inertia, I, using the following function. Moment of inertia, I Where I: moment of inertia in the x-axis (m) b: base or width of the rectangular beam (mm) h: height of the rectangular beam (mm) a) Import the classdata.xlsx in matlab. Save classdata in your current folder as classdata.mat b) Load classdata using matlab file editor. c) Write a command that returns the number of rows and number of columns in classdata. d) Write a command to display all the variables and their elements in classdata. Note: Do not suppress screen printing e) Compute variable h3 equal to the height of the beam raised to the power of 3. f) Write a command that computes the moment of inertia. I. (Note the units for I is m*) g) Plot the base vs inertia and height vs inertia on the same graph. (i.e. Use hold on command) h) Annotate your graphs appropriately (i.e xlabel, ylabel, title, units and legend) Note: Comment your program. base height 3.20 2.80 3.25 2.86 3.00 2.50 3.20 3.00 3.20 3.10 3.20 3.15 4.00 3.10 4.20 3.25 4.22 3.25 5.10 4.30
Step by Step Solution
There are 3 Steps involved in it

Get step-by-step solutions from verified subject matter experts