

Question: undefined (A) Create the following table below in Sheet1, starting from the cell A1 A B E F D Saplings growth report Growth in Apr
 undefined
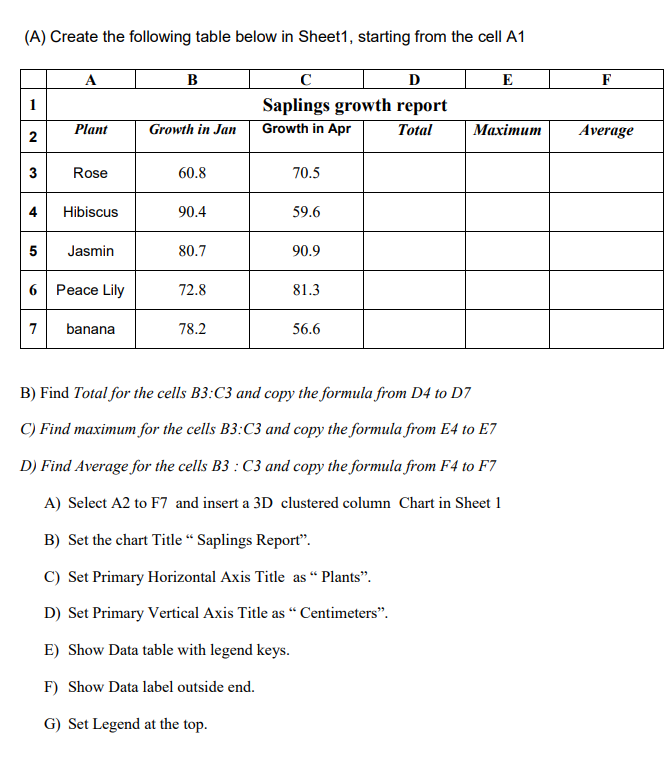
(A) Create the following table below in Sheet1, starting from the cell A1 A B E F D Saplings growth report Growth in Apr Total Plant 2 Growth in Jan Maximum Average 3 3 Rose 60.8 70.5 4 Hibiscus 90.4 59.6 5 Jasmin 80.7 90.9 6 Peace Lily 72.8 81.3 7 banana 78.2 56.6 B) Find Total for the cells B3:C3 and copy the formula from D4 to D7 C) Find maximum for the cells B3:C3 and copy the formula from E4 to E7 D) Find Average for the cells B3 : C3 and copy the formula from F4 to F7 A) Select A2 to F7 and insert a 3D clustered column Chart in Sheet 1 B) Set the chart Title Saplings Report. C) Set Primary Horizontal Axis Title as Plants. D) Set Primary Vertical Axis Title as Centimeters. E) Show Data table with legend keys. F) Show Data label outside end. G) Set Legend at the top
Step by Step Solution
There are 3 Steps involved in it

Get step-by-step solutions from verified subject matter experts