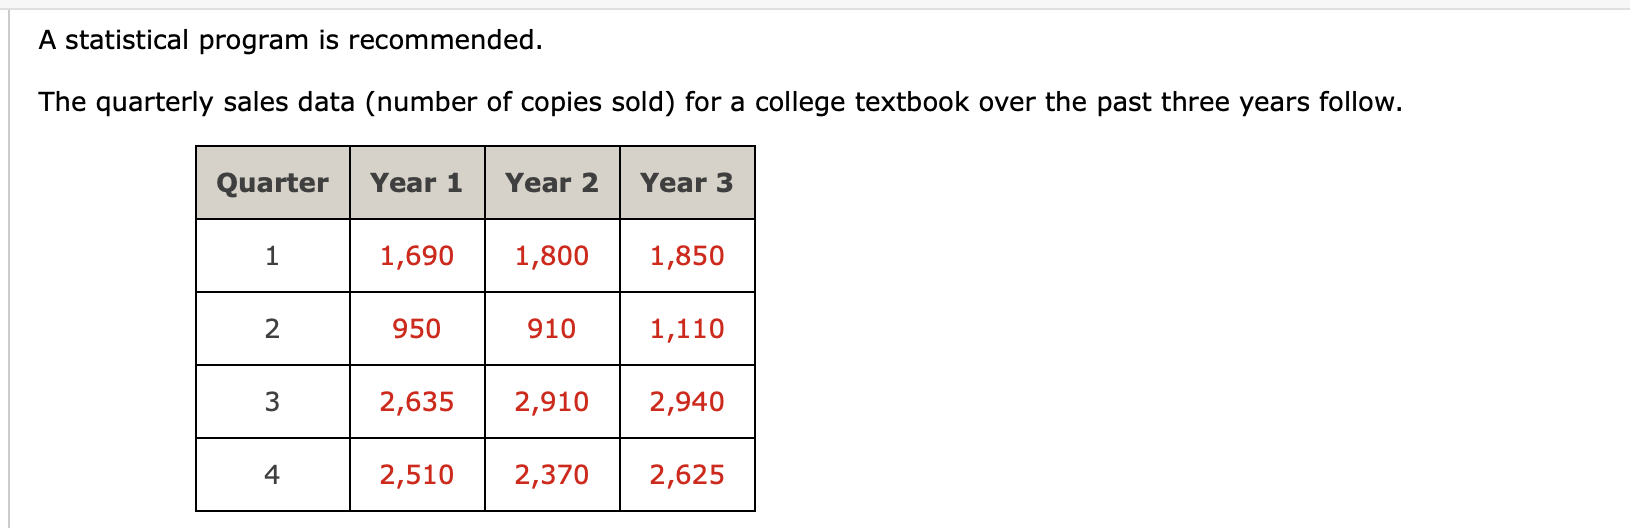
Question: undefined A statistical program is recommended. The quarterly sales data (number of copies sold) for a college textbook over the past three years follow. Quarter

undefined A statistical program is recommended.undefined A statistical program is recommended.undefined A statistical program is recommended.undefined

A statistical program is recommended. The quarterly sales data (number of copies sold) for a college textbook over the past three years follow. Quarter Year 1 Year 2 Year 3 1 1,690 1,800 1,850 2 950 910 1,110 2,635 2,910 2,940 4 2,510 2,370 2,625 (a) Construct a time series plot. 3500 3500 3000 3000 2500 2500 2000 2000 N 1500+ 1500 1000 1000 500+ 500 0 1 1 1 2 3 4 4 1 2 3 4 1 2 3 4 1 2 3 4 Year 1 Year 2 Year 3 Year 1 1 2 3 4 1 2 3 Year 2 Year 3 Year/Quarter Year/Quarter 3500 3500 3000 3000 2500 2500 2000 2000 Number of Copies Sold w Number of Copies Sold 1500 1500 1000 1000- 500 500 1 0 1 0 1 2 3 4 Year 1 1 2 3 4 1 2 3 4 Year 2 Year 3 1 2 3 4 1 2 3 4 1 2 3 4 Year 1 Year 2 Year 3 Year/Quarter 0 C Year/Quarter What type pattern exists in the data? There appears be a downward linear trend but no seasonal pattern i the data, There appears to be a seasonal pattern in the data and perhaps a moderate downward linear trend. There appears be an upward linear trend but no seasonal pattern in the data. There appears to be a seasonal pattern in the data and perhaps a moderate upward linear trend. (b) Use a regression model with dummy variables as follows to develop an equation to account for seasonal effects in the data. (Round your numerical values to the nearest integer.) x2 = 1 if quarter 1, 0 otherwise; X2 = 1 if quarter 2,0 otherwise; g = 1 if quarter 3, 0 otherwise (c) Using the equation developed in part (b), compute the quarterly forecasts for year 4. (Round your answers to the nearest ten.) quarter 1 forecast quarter 2 forecast quarter forecast quarter forecast (d) Let t = 1 refer to the observation in Quarter 1 of Year 1; let t = 2 refer to the observation in Quarter 2 of Year 1; and t = 12 to refer to the observation in Quarter 4 of Year 3. Using the dummy variables defined in part (b) and also using t, develop an equation to account for seasonal effects and any linear trendi the time series. (Round your numerical values to the nearest integer.) *= Based upon the seasonal effects in the data and linear trend, compute the quarterly forecasts for year 4. (Round your answers to the nearest ten.) quarter 1 forecast quarter 2 forecast quarter 3 forecast quarter forecast

Step by Step Solution

There are 3 Steps involved in it

1 Expert Approved Answer
Step: 1 Unlock blur-text-image
Question Has Been Solved by an Expert!

Get step-by-step solutions from verified subject matter experts

Step: 2 Unlock
Step: 3 Unlock

Students Have Also Explored These Related General Management Questions!