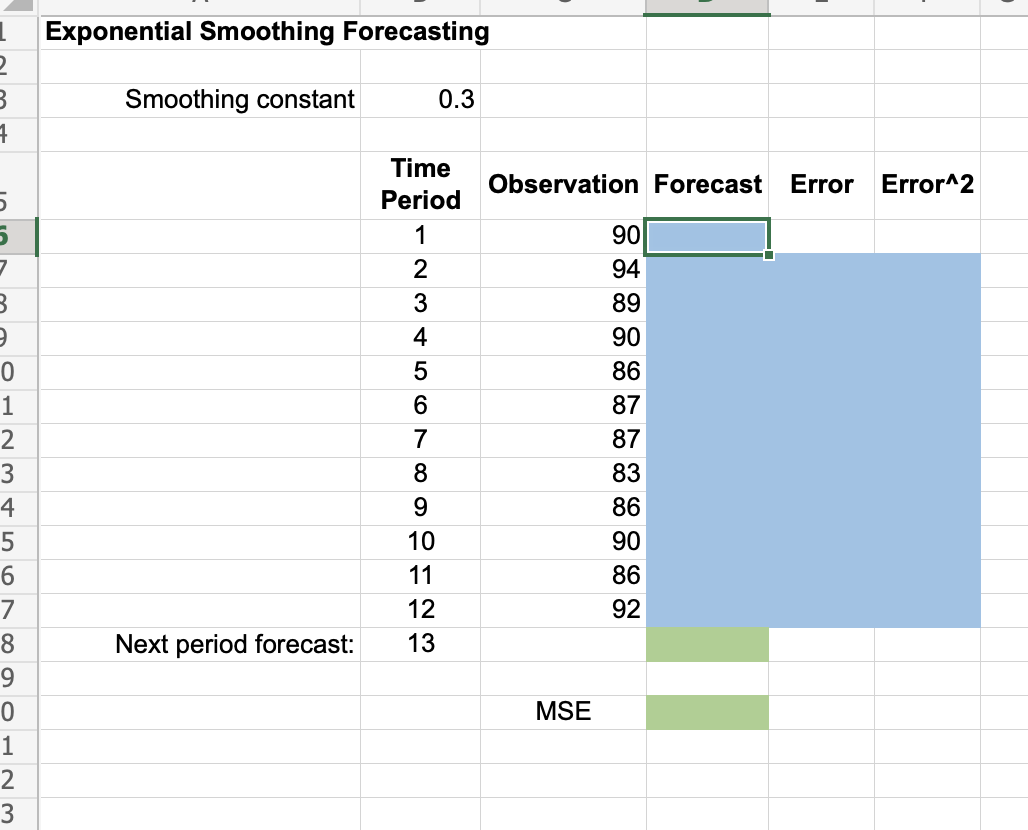
Question: undefined Exponential Smoothing Forecasting 1 2 B 1 Smoothing constant 0.3 Observation Forecast Error Error^2 5. Time Period 1 2 5 7 3. 3 4

undefined Exponential Smoothing Forecasting 1 2 Bundefined Exponential Smoothing Forecasting 1 2 Bundefined Exponential Smoothing Forecasting 1 2 Bundefined Exponential Smoothing Forecasting 1 2 Bundefined

Exponential Smoothing Forecasting 1 2 B 1 Smoothing constant 0.3 Observation Forecast Error Error^2 5. Time Period 1 2 5 7 3. 3 4 5 6 7 90 94 89 90 86 87 87 83 86 90 86 92 0 1 2 3 4 5 6 7 8 8 9 10 11 12 13 Next period forecast: MSE 9 0 1 2 3 A retail store records customer demand during each sales period. The data has been collected in the Microsoft Excel Online file below. Use the Microsoft Excel Online file below to develop the single exponential smoothing forecast and answer the following questions. X Open spreadsheet Questions 1. What is the forecast for the 13th period based on the single exponential smoothing? Round your answer to two decimal places. 2. What is the MSE for the single exponential smoothing forecast? Round your answer to two decimal places. 3. Choose the correct graph for the single exponential smoothing forecast. The correct graph is Observation Forecast 100 Exponential Smoothing Forecast 95 90 AVAL A. 85 Observation Forecast 100 Exponential Smoothing Forecast 95+ 90 B. 85 80 Time Period 2 3 6 9 10 11 12 13 14 100 Observation Forecast Exponential Smoothing Forecast 95 90 4 C. 85 80 Time Period 3 6 9 10 11 12 13 14 Observation Forecast Exponential Smoothing Forecast 100 95 90 D. 85 80 Time Period 2 3 4 6 7 8 9 10 11 12 13 14

Step by Step Solution

There are 3 Steps involved in it

1 Expert Approved Answer
Step: 1 Unlock blur-text-image
Question Has Been Solved by an Expert!

Get step-by-step solutions from verified subject matter experts

Step: 2 Unlock
Step: 3 Unlock

Students Have Also Explored These Related General Management Questions!