

Question: Under the assumptions that Ideko's market share will increase by 0.55 percent per year (implying that the investment, financing, and depreciation will be adjusted accordingly)
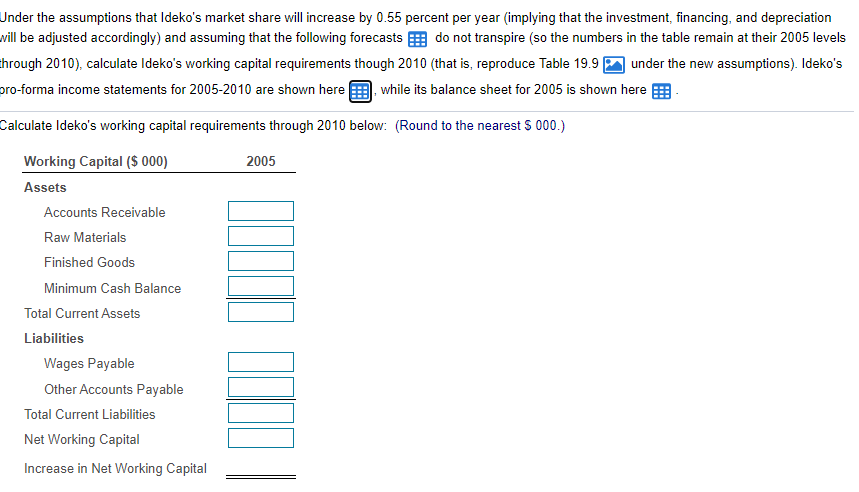
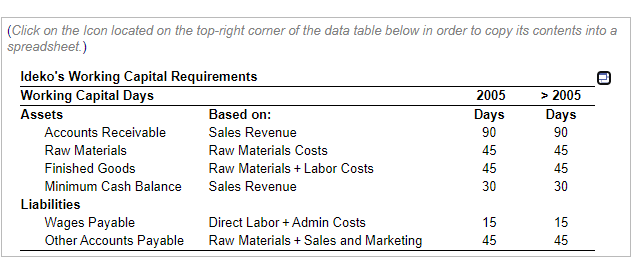
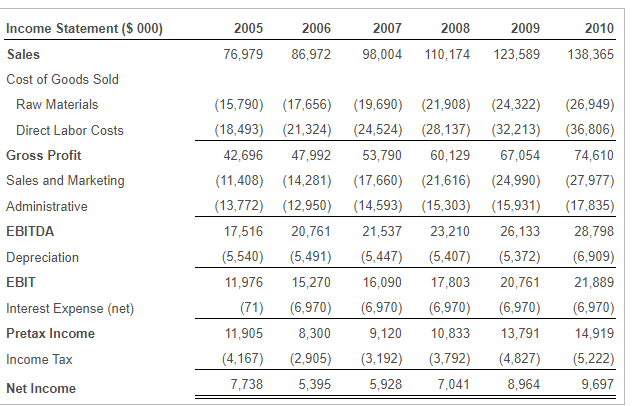
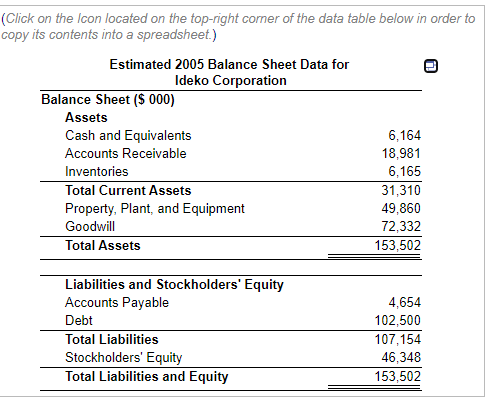
Under the assumptions that Ideko's market share will increase by 0.55 percent per year (implying that the investment, financing, and depreciation will be adjusted accordingly) and assuming that the following forecasts do not transpire (so the numbers in the table remain at their 2005 levels through 2010), calculate Ideko's working capital requirements though 2010 (that is, reproduce Table 19.9 under the new assumptions). Ideko's pro-forma income statements for 2005-2010 are shown here while its balance sheet for 2005 is shown here Calculate Ideko's working capital requirements through 2010 below: (Round to the nearest 5 000.) 2005 Working Capital ($ 000) Assets Accounts Receivable Raw Materials Finished Goods Minimum Cash Balance Total Current Assets Liabilities Wages Payable Other Accounts Payable Total Current Liabilities Net Working Capital Increase in Net Working Capital | lll (Click on the Icon located on the top-right corner of the data table below in order to copy its contents into a spreadsheet.) Ideko's Working Capital Requirements Working Capital Days 2005 > 2005 Assets Based on: Days Days Accounts Receivable Sales Revenue 90 90 Raw Materials Raw Materials Costs 45 45 Finished Goods Raw Materials + Labor Costs 45 45 Minimum Cash Balance Sales Revenue 30 30 Liabilities Wages Payable Direct Labor + Admin Costs 15 15 Other Accounts Payable Raw Materials + Sales and Marketing 45 45 2005 2006 2010 2007 98,004 2008 110,174 2009 123,589 76,979 86,972 138,365 Income Statement ($ 000) Sales Cost of Goods Sold Raw Materials Direct Labor Costs Gross Profit Sales and Marketing Administrative EBITDA Depreciation EBIT Interest Expense (net) Pretax Income Income Tax (15,790) (17,656) (19,690) (18,493) (21,324) (24,524) 42,696 47,992 53,790 (11,408) (14,281) (17,660) (13,772) (12,950) (14,593) 17,516 20,761 21,537 (5,540) (5,491) (5,447) 11,976 15,270 16,090 (71) (6,970) (6,970) 11,905 8,300 9,120 (4,167) (2,905) (3,192) 7,738 5,395 5,928 (21,908) (24,322) (28,137) (32,213) 60,129 67,054 (21,616) (24,990) (15,303) (15,931) 23,210 26,133 (5,407) (5,372) 17,803 20,761 (6,970) (6,970) 10,833 13,791 (3,792) (4,827) 7,041 8,964 (26,949) (36,806) 74,610 (27,977) (17,835) 28,798 (6,909) 21,889 (6,970) 14,919 (5,222) 9,697 Net Income (Click on the Icon located on the top-right corner of the data table below in order to copy its contents into a spreadsheet.) Estimated 2005 Balance Sheet Data for Ideko Corporation Balance Sheet ($ 000) Assets Cash and Equivalents 6,164 Accounts Receivable 18,981 Inventories 6,165 Total Current Assets 31,310 Property, Plant, and Equipment 49,860 Goodwill 72,332 Total Assets 153,502 Liabilities and Stockholders' Equity Accounts Payable Debt Total Liabilities Stockholders' Equity Total Liabilities and Equity 4,654 102,500 107,154 46,348 153,502
Step by Step Solution
There are 3 Steps involved in it

Get step-by-step solutions from verified subject matter experts