

Question: Under the assumptions that Ideko's market share will increase by 0.55 percent per year (implying that the investment, financing, and depreciation will be adjusted accordingly)
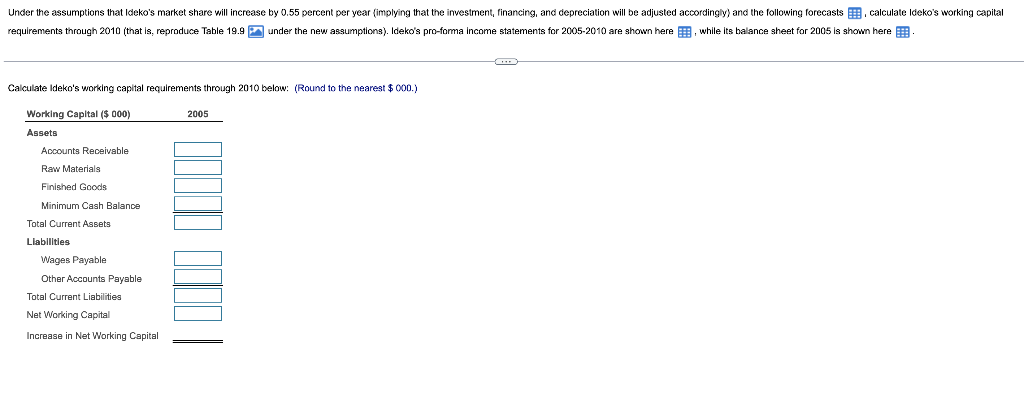
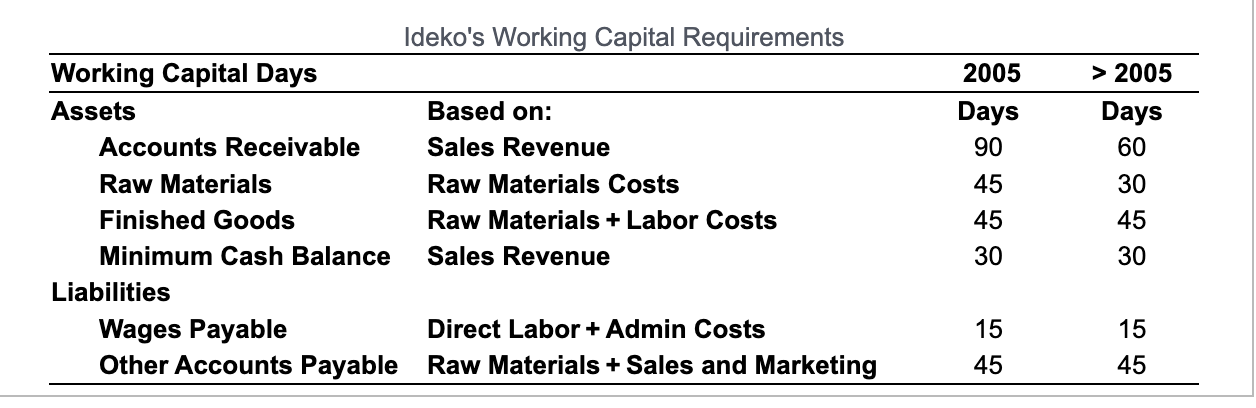
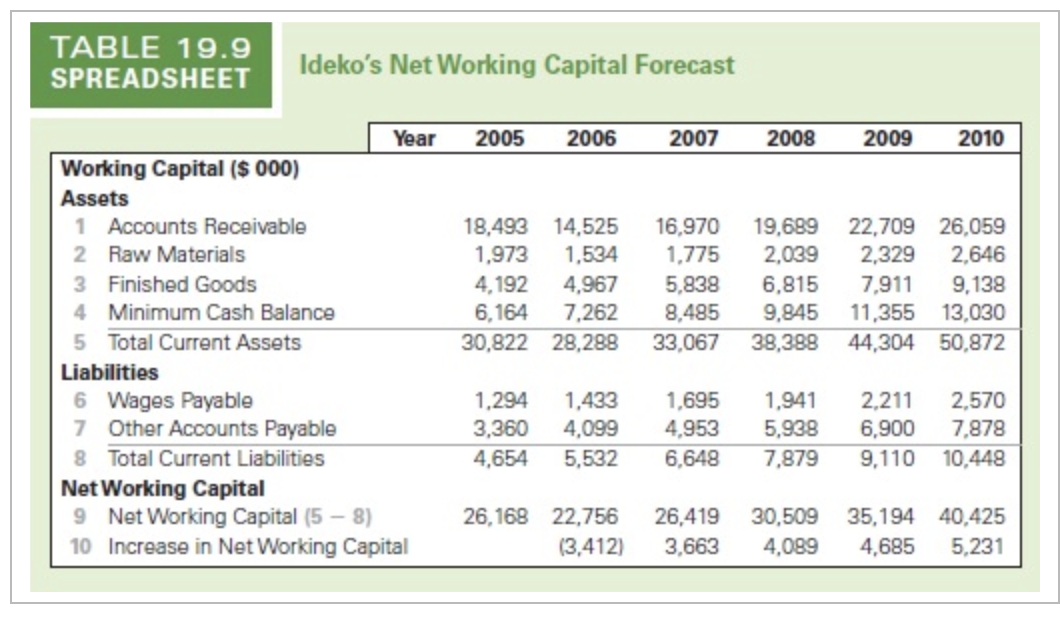
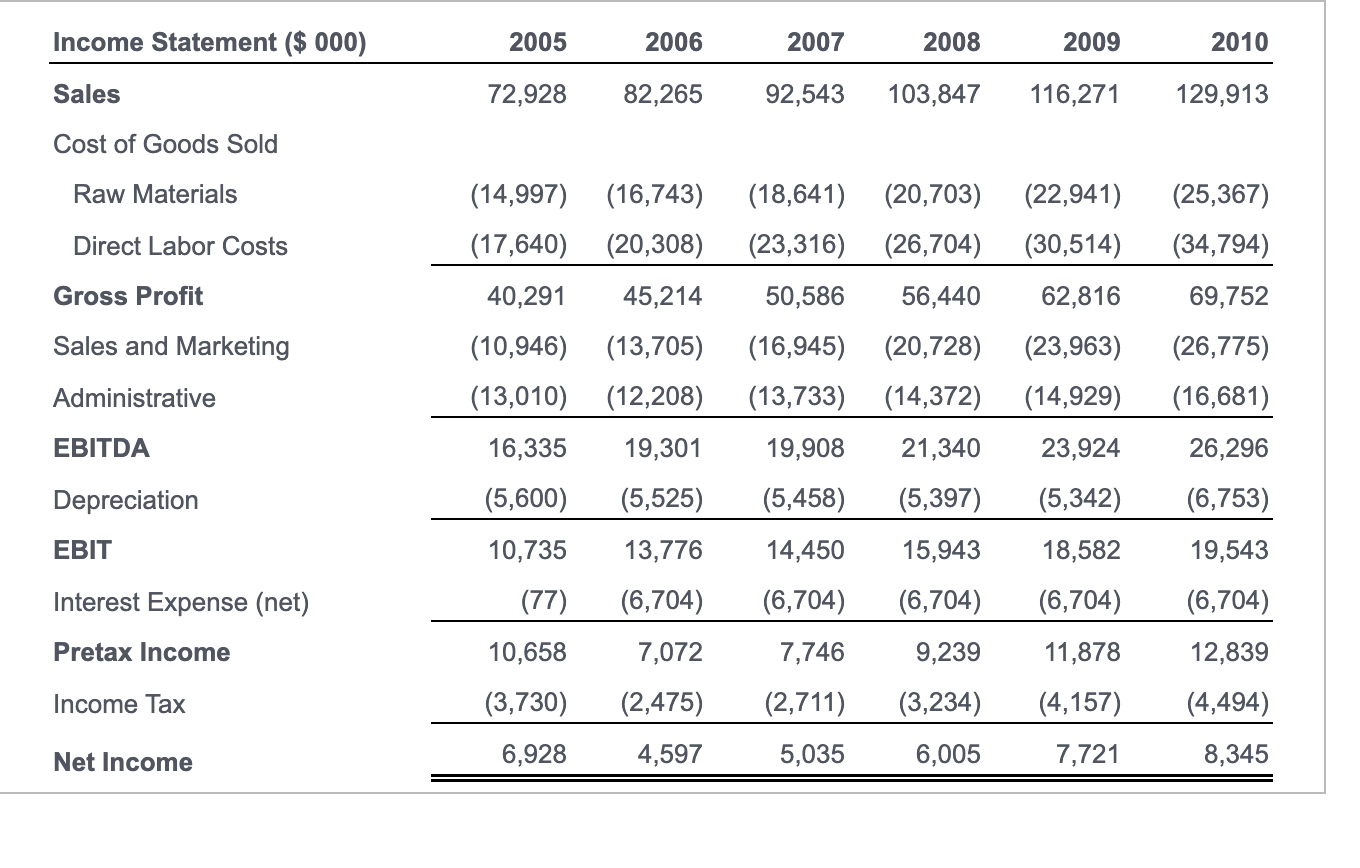
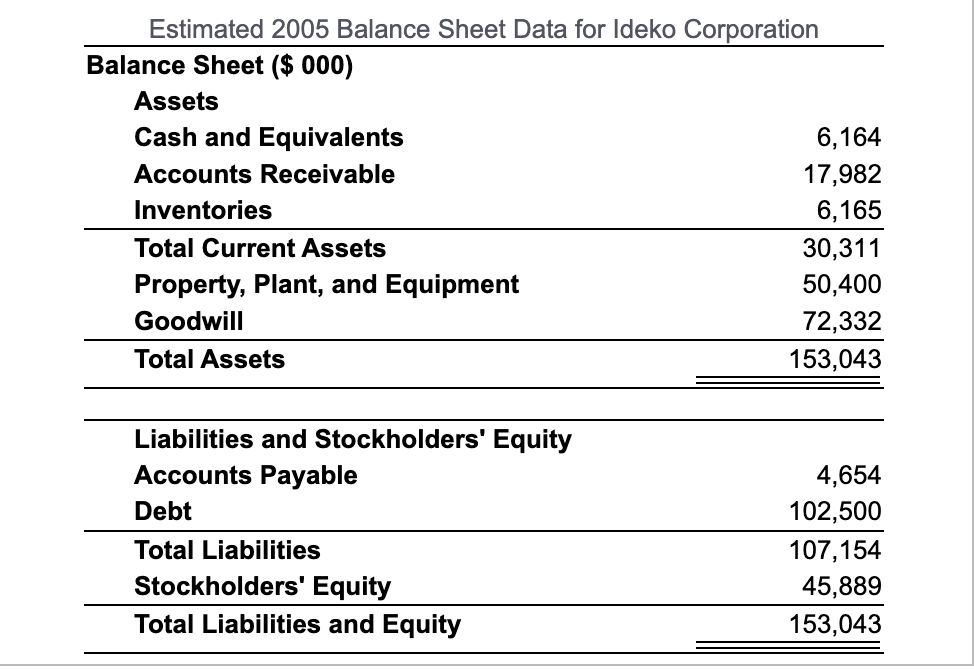
Under the assumptions that Ideko's market share will increase by 0.55 percent per year (implying that the investment, financing, and depreciation will be adjusted accordingly) and the following forecasts. calculate Ideko's working capital requirements through 2010 (that is, reproduce Table 19.9 under the new assumptions). Ideko's pro-forma income statements for 2005-2010 are shown here, while its balance sheet for 2005 is shown here B. Calculate Ideko's working capital requirements through 2010 below: (Round to the nearest $ 000.) Working Capital 000) 2005 Assets Accounts Receivable Raw Materials Finished Goods Minimum Cash Balance Total Current Assets Llabilities Wages Payable Other Accounts Payable Total Current Liabilities Net Working Capital Increase in Net Working Capital 2005 Days 90 > 2005 Days 60 45 30 Ideko's Working Capital Requirements Working Capital Days Assets Based on: Accounts Receivable Sales Revenue Raw Materials Raw Materials Costs Finished Goods Raw Materials + Labor Costs Minimum Cash Balance Sales Revenue Liabilities Wages Payable Direct Labor + Admin Costs Other Accounts Payable Raw Materials + Sales and Marketing 45 45 30 30 15 15 45 45 TABLE 19.9 SPREADSHEET Ideko's Net Working Capital Forecast 2005 2006 2007 2008 2009 2010 Year Working Capital ($ 000) Assets 1 Accounts Receivable 2 Raw Materials 3 Finished Goods 4 Minimum Cash Balance 5 Total Current Assets Liabilities 6 Wages Payable 7 Other Accounts Payable 8 Total Current Liabilities Net Working Capital 9 Net Working Capital (5 - 8) 10 Increase in Net Working Capital 18,493 14,525 1,973 1,534 4,192 4,967 6,164 7,262 30,822 28,288 16,970 1,775 5,838 8,485 33,067 19,689 2,039 6,815 9,845 38,388 22,709 26,059 2.329 2.646 7,911 9,138 11,355 13,030 44,304 50,872 1,294 3,360 4,654 1,433 4,099 5,532 1,695 4,953 6,648 1,941 5,938 7,879 2.211 2,570 6,900 7,878 9,110 10,448 26,168 22,756 (3,412) 26,419 3,663 30,509 4,089 35,194 40,425 4,685 5,231 Income Statement ($ 000) 2005 2006 2007 2008 2009 2010 Sales 72,928 82,265 92,543 103,847 116,271 129,913 Cost of Goods Sold Raw Materials (14,997) (16,743) (17,640) (20,308) (18,641) (20,703) (23,316) (26,704) (22,941) (30,514) (25,367) (34,794) Direct Labor Costs Gross Profit 40,291 45,214 50,586 56,440 62,816 69,752 Sales and Marketing (10,946) (13,705) (13,010) (12,208) 16,335 19,301 (16,945) (13,733) Administrative (20,728) (14,372) 21,340 (23,963) (14,929) (26,775) (16,681) 26,296 EBITDA 19,908 23,924 Depreciation (5,600) (5,525) (5,458) (5,397) (5,342) (6,753) EBIT 10,735 13,776 14,450 15,943 18,582 19,543 Interest Expense (net) (77) (6,704) (6,704) (6,704) (6,704) (6,704) Pretax Income 10,658 7,072 7,746 9,239 11,878 12,839 Income Tax (3,730) (2,475) (2,711) (3,234) (4,157) (4,494) Net Income 6,928 4,597 5,035 6,005 7,721 8,345 Estimated 2005 Balance Sheet Data for Ideko Corporation Balance Sheet ($ 000) Assets Cash and Equivalents 6,164 Accounts Receivable 17,982 Inventories 6,165 Total Current Assets 30,311 Property, Plant, and Equipment 50,400 Goodwill 72,332 Total Assets 153,043 Liabilities and Stockholders' Equity Accounts Payable Debt Total Liabilities Stockholders' Equity Total Liabilities and Equity 4,654 102,500 107,154 45,889 __153,043 Under the assumptions that Ideko's market share will increase by 0.55 percent per year (implying that the investment, financing, and depreciation will be adjusted accordingly) and the following forecasts. calculate Ideko's working capital requirements through 2010 (that is, reproduce Table 19.9 under the new assumptions). Ideko's pro-forma income statements for 2005-2010 are shown here, while its balance sheet for 2005 is shown here B. Calculate Ideko's working capital requirements through 2010 below: (Round to the nearest $ 000.) Working Capital 000) 2005 Assets Accounts Receivable Raw Materials Finished Goods Minimum Cash Balance Total Current Assets Llabilities Wages Payable Other Accounts Payable Total Current Liabilities Net Working Capital Increase in Net Working Capital 2005 Days 90 > 2005 Days 60 45 30 Ideko's Working Capital Requirements Working Capital Days Assets Based on: Accounts Receivable Sales Revenue Raw Materials Raw Materials Costs Finished Goods Raw Materials + Labor Costs Minimum Cash Balance Sales Revenue Liabilities Wages Payable Direct Labor + Admin Costs Other Accounts Payable Raw Materials + Sales and Marketing 45 45 30 30 15 15 45 45 TABLE 19.9 SPREADSHEET Ideko's Net Working Capital Forecast 2005 2006 2007 2008 2009 2010 Year Working Capital ($ 000) Assets 1 Accounts Receivable 2 Raw Materials 3 Finished Goods 4 Minimum Cash Balance 5 Total Current Assets Liabilities 6 Wages Payable 7 Other Accounts Payable 8 Total Current Liabilities Net Working Capital 9 Net Working Capital (5 - 8) 10 Increase in Net Working Capital 18,493 14,525 1,973 1,534 4,192 4,967 6,164 7,262 30,822 28,288 16,970 1,775 5,838 8,485 33,067 19,689 2,039 6,815 9,845 38,388 22,709 26,059 2.329 2.646 7,911 9,138 11,355 13,030 44,304 50,872 1,294 3,360 4,654 1,433 4,099 5,532 1,695 4,953 6,648 1,941 5,938 7,879 2.211 2,570 6,900 7,878 9,110 10,448 26,168 22,756 (3,412) 26,419 3,663 30,509 4,089 35,194 40,425 4,685 5,231 Income Statement ($ 000) 2005 2006 2007 2008 2009 2010 Sales 72,928 82,265 92,543 103,847 116,271 129,913 Cost of Goods Sold Raw Materials (14,997) (16,743) (17,640) (20,308) (18,641) (20,703) (23,316) (26,704) (22,941) (30,514) (25,367) (34,794) Direct Labor Costs Gross Profit 40,291 45,214 50,586 56,440 62,816 69,752 Sales and Marketing (10,946) (13,705) (13,010) (12,208) 16,335 19,301 (16,945) (13,733) Administrative (20,728) (14,372) 21,340 (23,963) (14,929) (26,775) (16,681) 26,296 EBITDA 19,908 23,924 Depreciation (5,600) (5,525) (5,458) (5,397) (5,342) (6,753) EBIT 10,735 13,776 14,450 15,943 18,582 19,543 Interest Expense (net) (77) (6,704) (6,704) (6,704) (6,704) (6,704) Pretax Income 10,658 7,072 7,746 9,239 11,878 12,839 Income Tax (3,730) (2,475) (2,711) (3,234) (4,157) (4,494) Net Income 6,928 4,597 5,035 6,005 7,721 8,345 Estimated 2005 Balance Sheet Data for Ideko Corporation Balance Sheet ($ 000) Assets Cash and Equivalents 6,164 Accounts Receivable 17,982 Inventories 6,165 Total Current Assets 30,311 Property, Plant, and Equipment 50,400 Goodwill 72,332 Total Assets 153,043 Liabilities and Stockholders' Equity Accounts Payable Debt Total Liabilities Stockholders' Equity Total Liabilities and Equity 4,654 102,500 107,154 45,889 __153,043
Step by Step Solution
There are 3 Steps involved in it
To calculate Idekos working capital requirements through 2010 you need to compute the values based on the given information These calculations are bas... View full answer

Get step-by-step solutions from verified subject matter experts