

Question: Uniform (0,1) random numbers Arrival Service Process Process 0.5869 0.0741 0.2853 0.2281 0.6724 0.9944 0.0788 0.9362 0.0159 0.2952 0.9495 0.8167 0.1131 0.5371 0.8791 0.4974 0.6294
Uniform (0,1) random numbers
| Arrival | Service |
| Process | Process |
| 0.5869 | 0.0741 |
| 0.2853 | 0.2281 |
| 0.6724 | 0.9944 |
| 0.0788 | 0.9362 |
| 0.0159 | 0.2952 |
| 0.9495 | 0.8167 |
| 0.1131 | 0.5371 |
| 0.8791 | 0.4974 |
| 0.6294 | 0.5182 |
| 0.2783 | 0.7495 |
| 0.1785 | 0.8375 |
| 0.1797 | 0.9075 |
| 0.1998 | 0.4001 |
| 0.9359 | 0.8634 |
| 0.0988 | 0.6248 |
| 0.8611 | 0.4925 |
| 0.3693 | 0.0727 |
| 0.5062 | 0.3358 |
| 0.6527 | 0.609 |
| 0.2203 | 0.5082 |
| 0.0473 | 0.1585 |
| 0.7819 | 0.2461 |
| 0.6514 | 0.4259 |
| 0.7718 | 0.5284 |
| 0.0935 | 0.5876 |
| 0.3759 | 0.2863 |
| 0.3178 | 0.6421 |
| 0.6704 | 0.2706 |
| 0.8684 | 0.613 |
| 0.071 | 0.1227 |
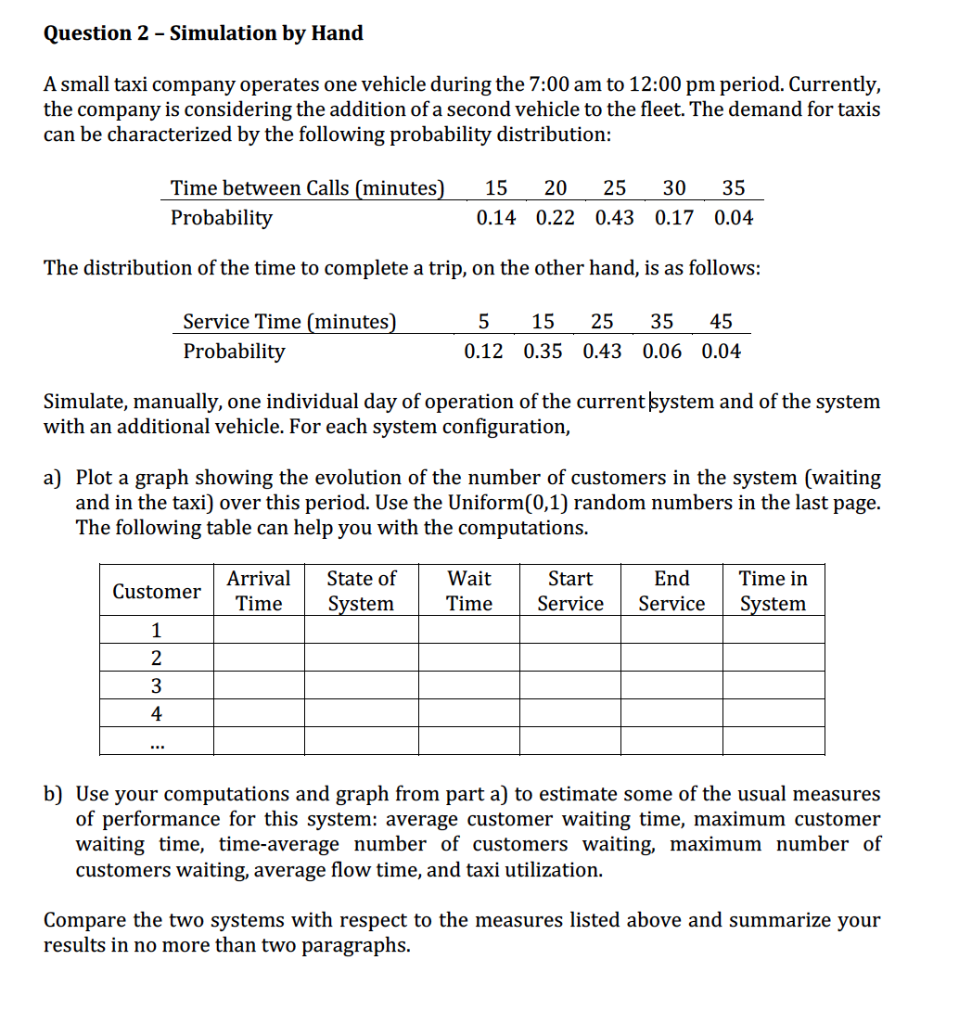
Question 2 - Simulation by Hand A small taxi company operates one vehicle during the 7:00 am to 12:00 pm period. Currently, the company is considering the addition of a second vehicle to the fleet. The demand for taxis can be characterized by the following probability distribution: Time between Calls (minutes) Probability 15 20 25 30 35 0.14 0.22 0.43 0.17 0.04 The distribution of the time to complete a trip, on the other hand, is as follows: Service Time (minutes) Probability 5 15 25 35 45 0.12 0.35 0.43 0.06 0.04 Simulate, manually, one individual day of operation of the current system and of the system with an additional vehicle. For each system configuration, a) Plot a graph showing the evolution of the number of customers in the system (waiting and in the taxi) over this period. Use the Uniform(0,1) random numbers in the last page. The following table can help you with the computations. Customer Arrival Time State of System Wait Time Start Service End Service Time in System 1 2 3 4 b) Use your computations and graph from part a) to estimate some of the usual measures of performance for this system: average customer waiting time, maximum customer waiting time, time-average number of customers waiting, maximum number of customers waiting, average flow time, and taxi utilization. Compare the two systems with respect to the measures listed above and summarize your results in no more than two paragraphs
Step by Step Solution
There are 3 Steps involved in it

Get step-by-step solutions from verified subject matter experts