

Question: Unit 1: Mea Binning Data 1. Suppose you are curious about the distribution of heights among teenagers. Use the data below-the heights of 40 teenagers
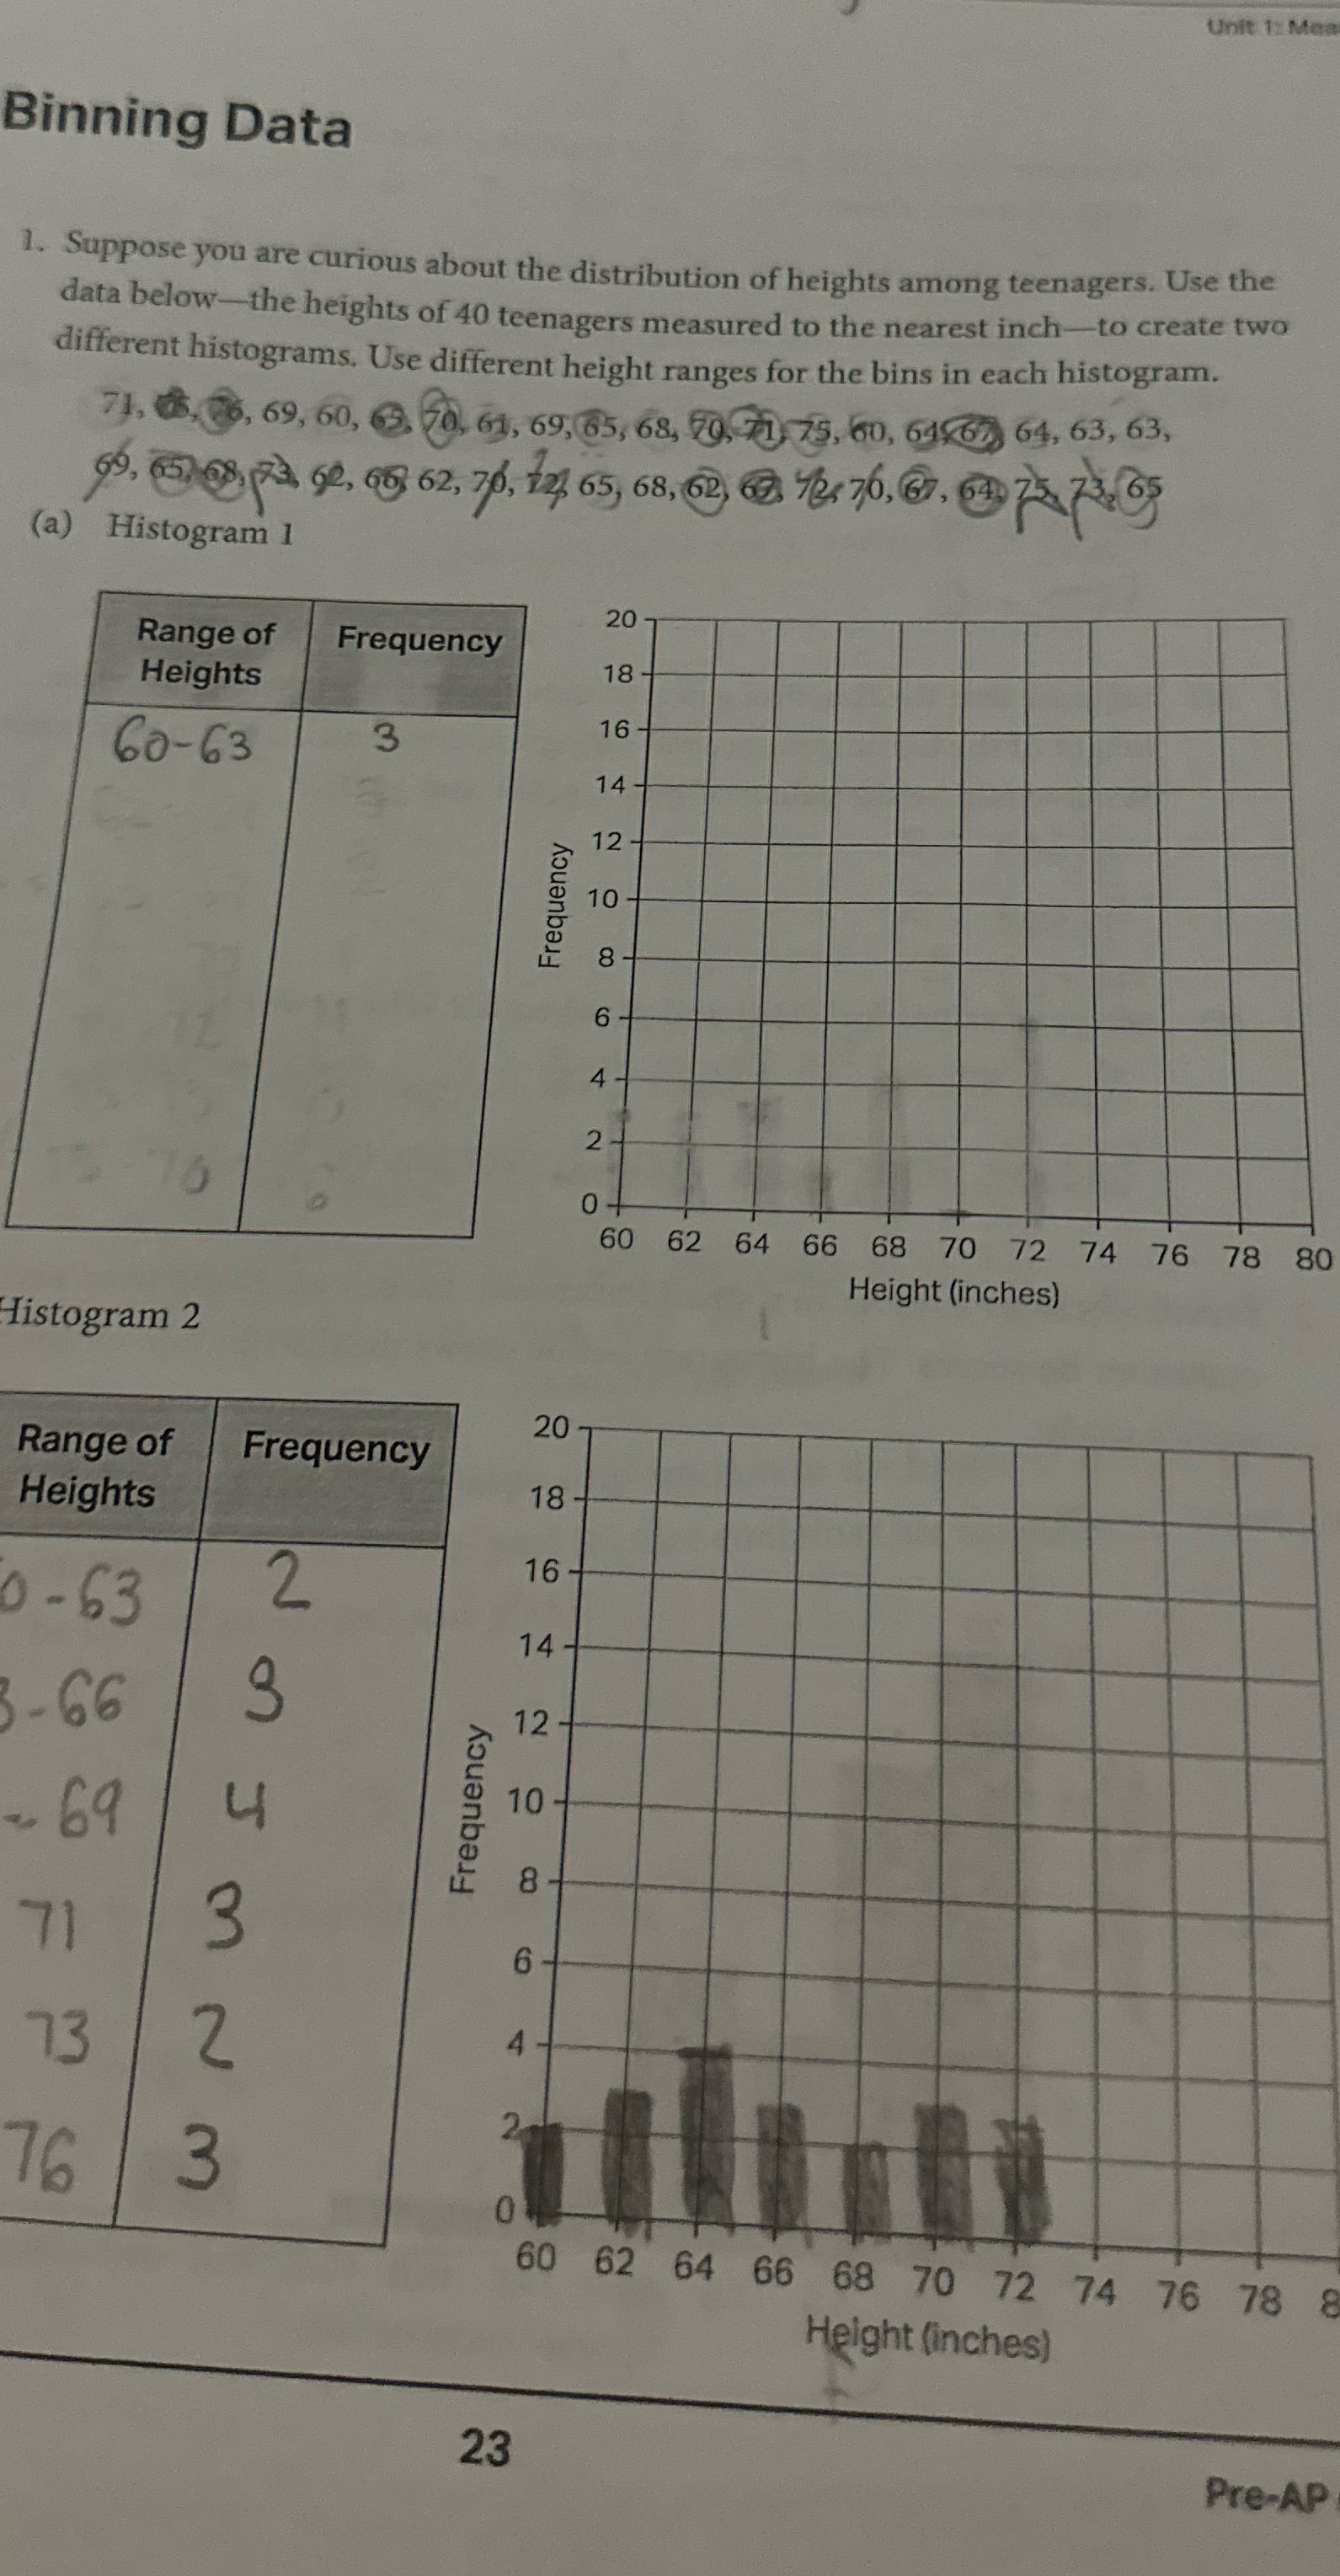
Unit 1: Mea Binning Data 1. Suppose you are curious about the distribution of heights among teenagers. Use the data below-the heights of 40 teenagers measured to the nearest inch-to create two different histograms. Use different height ranges for the bins in each histogram. 71, 65, 56, 69, 60, . 50, 61, 69, 65, 68, 20, 71 75, 60, 61962 64, 63, 63, 95, 65708, (x2 ge, 65 62, 70, 12 65 , 68, 62 612 76. 60176 (a) Histogram 1 20 Range of Frequency Heights 18 60-63 3 16 14 12 10 Frequency A N 60 62 64 66 68 70 72 74 76 78 80 Height (inches) Histogram 2 20 Range of Frequency Heights 18 - 16 - 0- 63 2 14 - -66 12 - 69 Frequency 10 8 71 WN WS Up 6 73 4 76 0 60 62 64 66 68 70 72 74 76 78 Height (inches) 23 Pre-AP
Step by Step Solution
There are 3 Steps involved in it

Get step-by-step solutions from verified subject matter experts