

Question: UNIT 2. SUMMARIZING DATA GRAPHICALLY AND NUMERICALLY College n Min Q1 Q2 Q3 8 43.2 50.5 63.75 71.1 Max 8 67.3 69.5 70.15 73.5 73.8
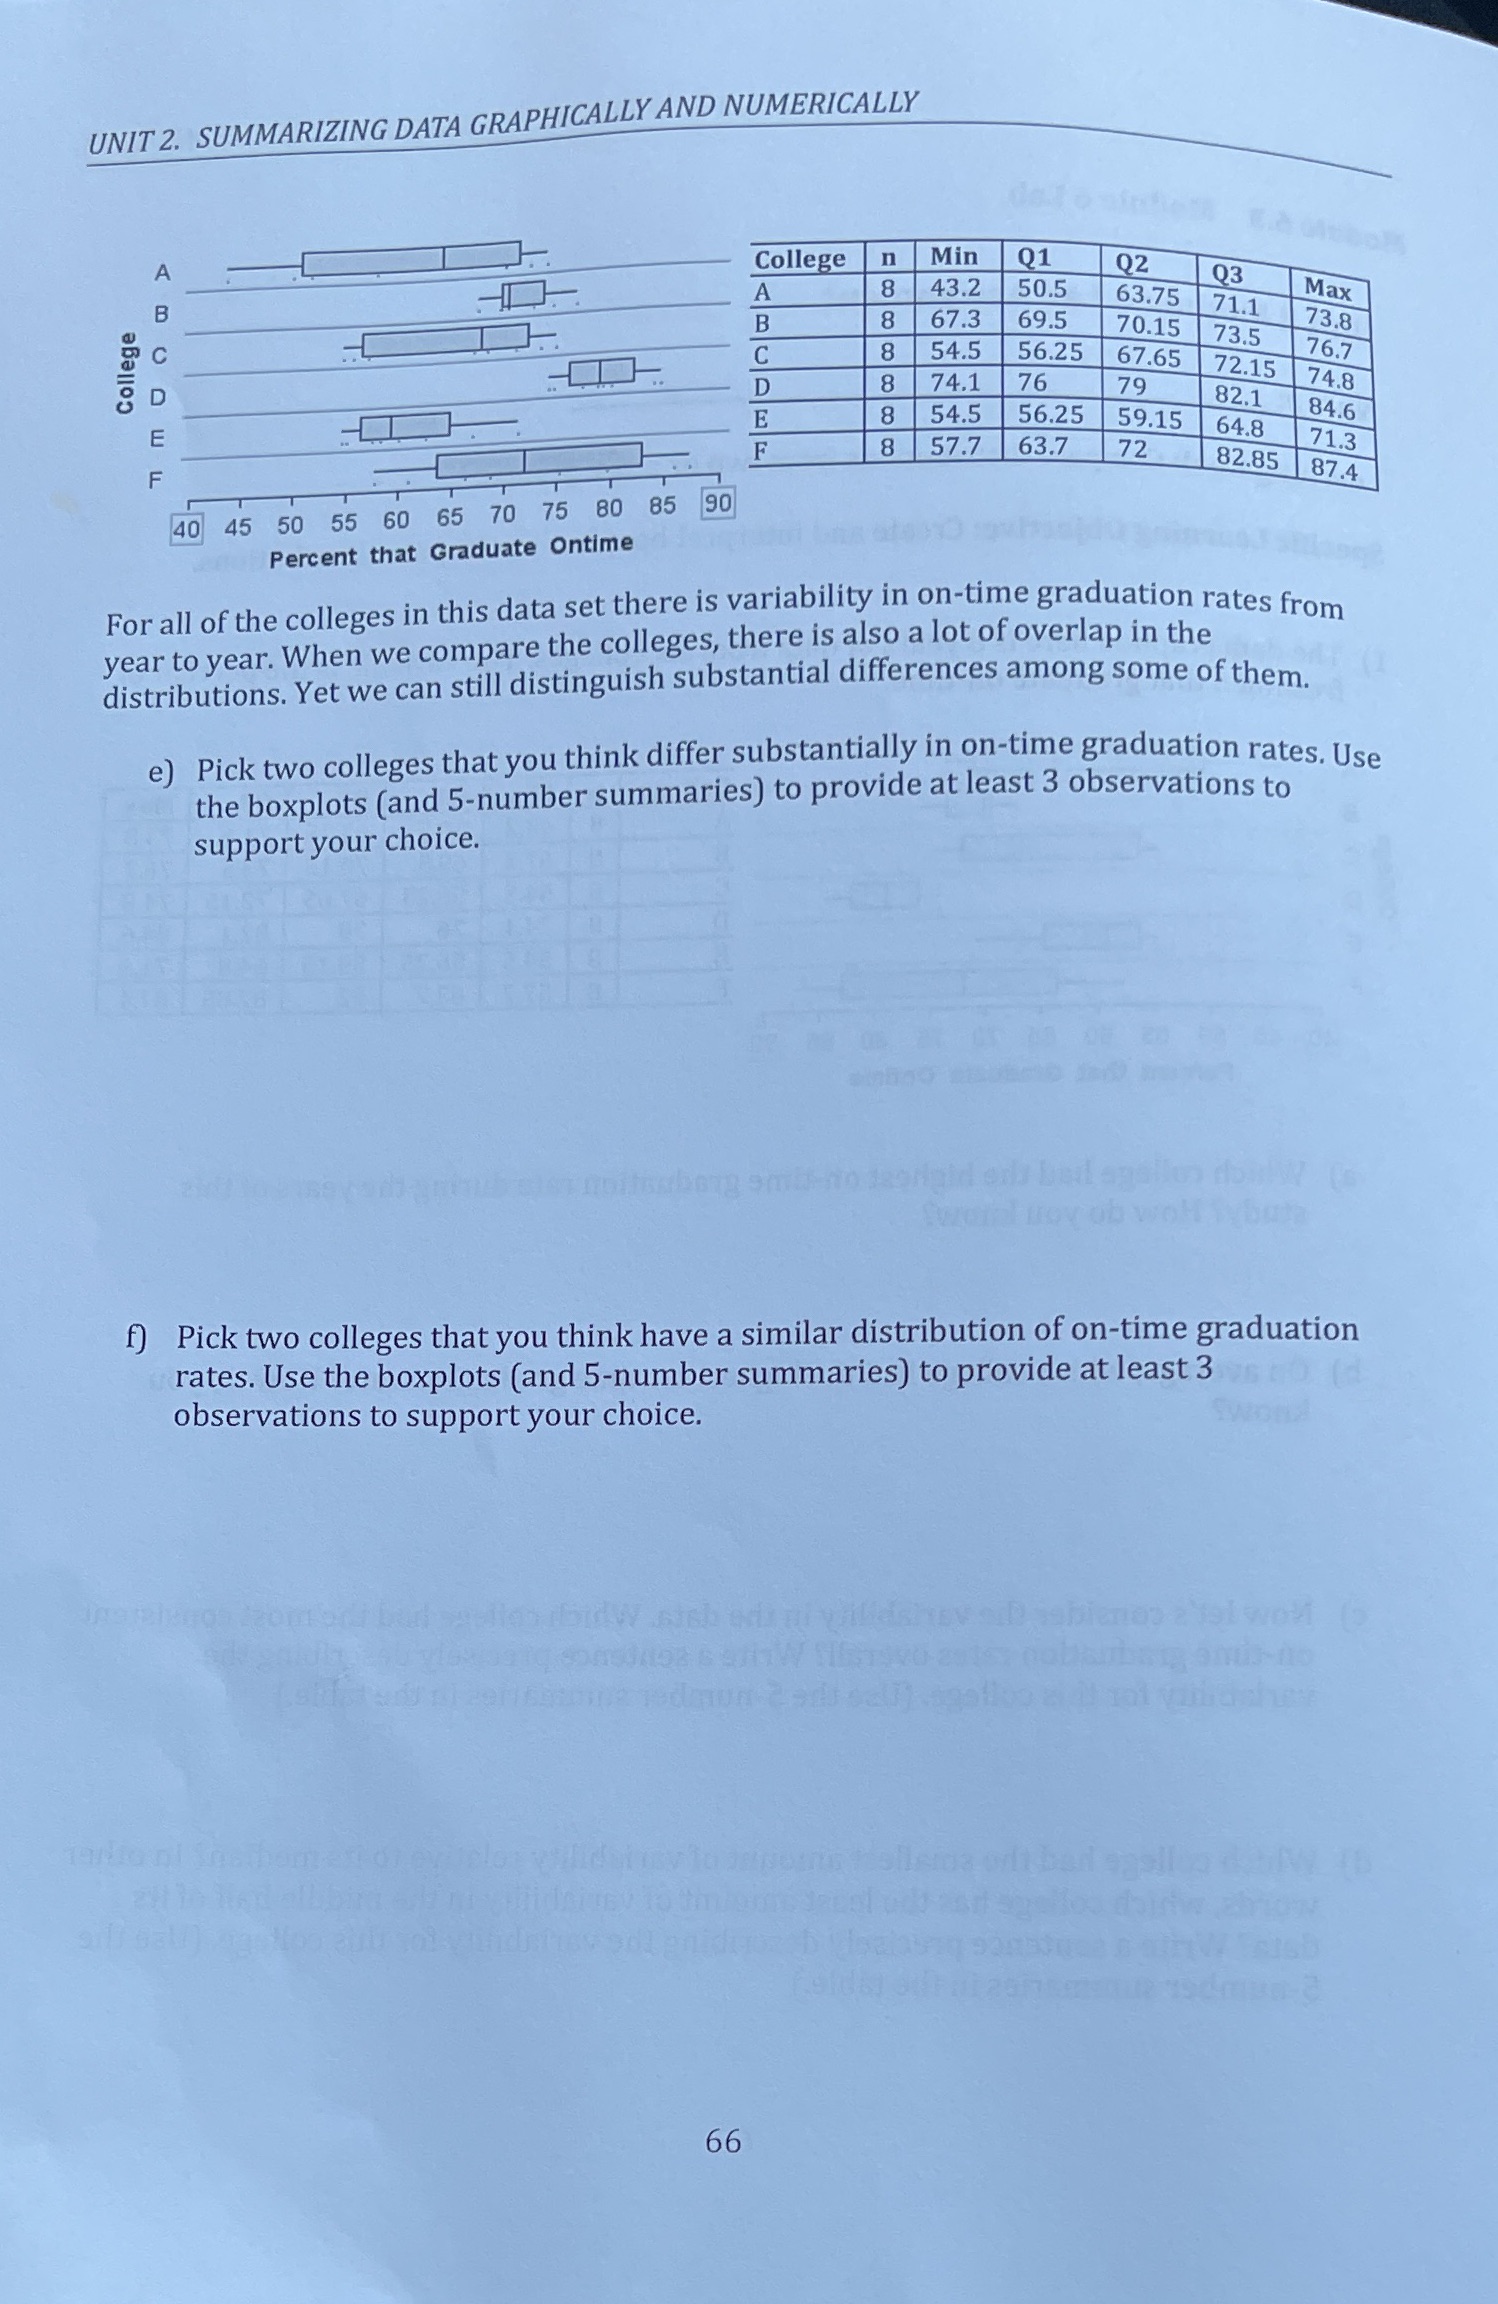
UNIT 2. SUMMARIZING DATA GRAPHICALLY AND NUMERICALLY College n Min Q1 Q2 Q3 8 43.2 50.5 63.75 71.1 Max 8 67.3 69.5 70.15 73.5 73.8 8 54.5 56.25 76.7 College 8 74.1 67.65 72.15 74.8 76 79 82.1 8 54.5 56.25 59.15 64.8 84.6 8 57.7 63.7 72 71.3 82.85 87.4 40 45 50 55 60 65 70 75 80 85 90 Percent that Graduate Ontime For all of the colleges in this data set there is variability in on-time graduation rates from year to year. When we compare the colleges, there is also a lot of overlap in the distributions. Yet we can still distinguish substantial differences among some of them. e) Pick two colleges that you think differ substantially in on-time graduation rates. Use the boxplots (and 5-number summaries) to provide at least 3 observations to support your choice. f) Pick two colleges that you think have a similar distribution of on-time graduation rates. Use the boxplots (and 5-number summaries) to provide at least 3 observations to support your choice. 66
Step by Step Solution
There are 3 Steps involved in it

Get step-by-step solutions from verified subject matter experts