

Question: unknown length containing x and y values and then computes a line that best fits the data set. Remember, a line is defined by the
unknown length containing and values and then computes a line that best fits the data set. Remember, a
line is defined by the equation where is the slope and is the intercept of the line. Such a
linear fit is commonly used to visualize linear trends of data. You will then plot the data set using a scatter
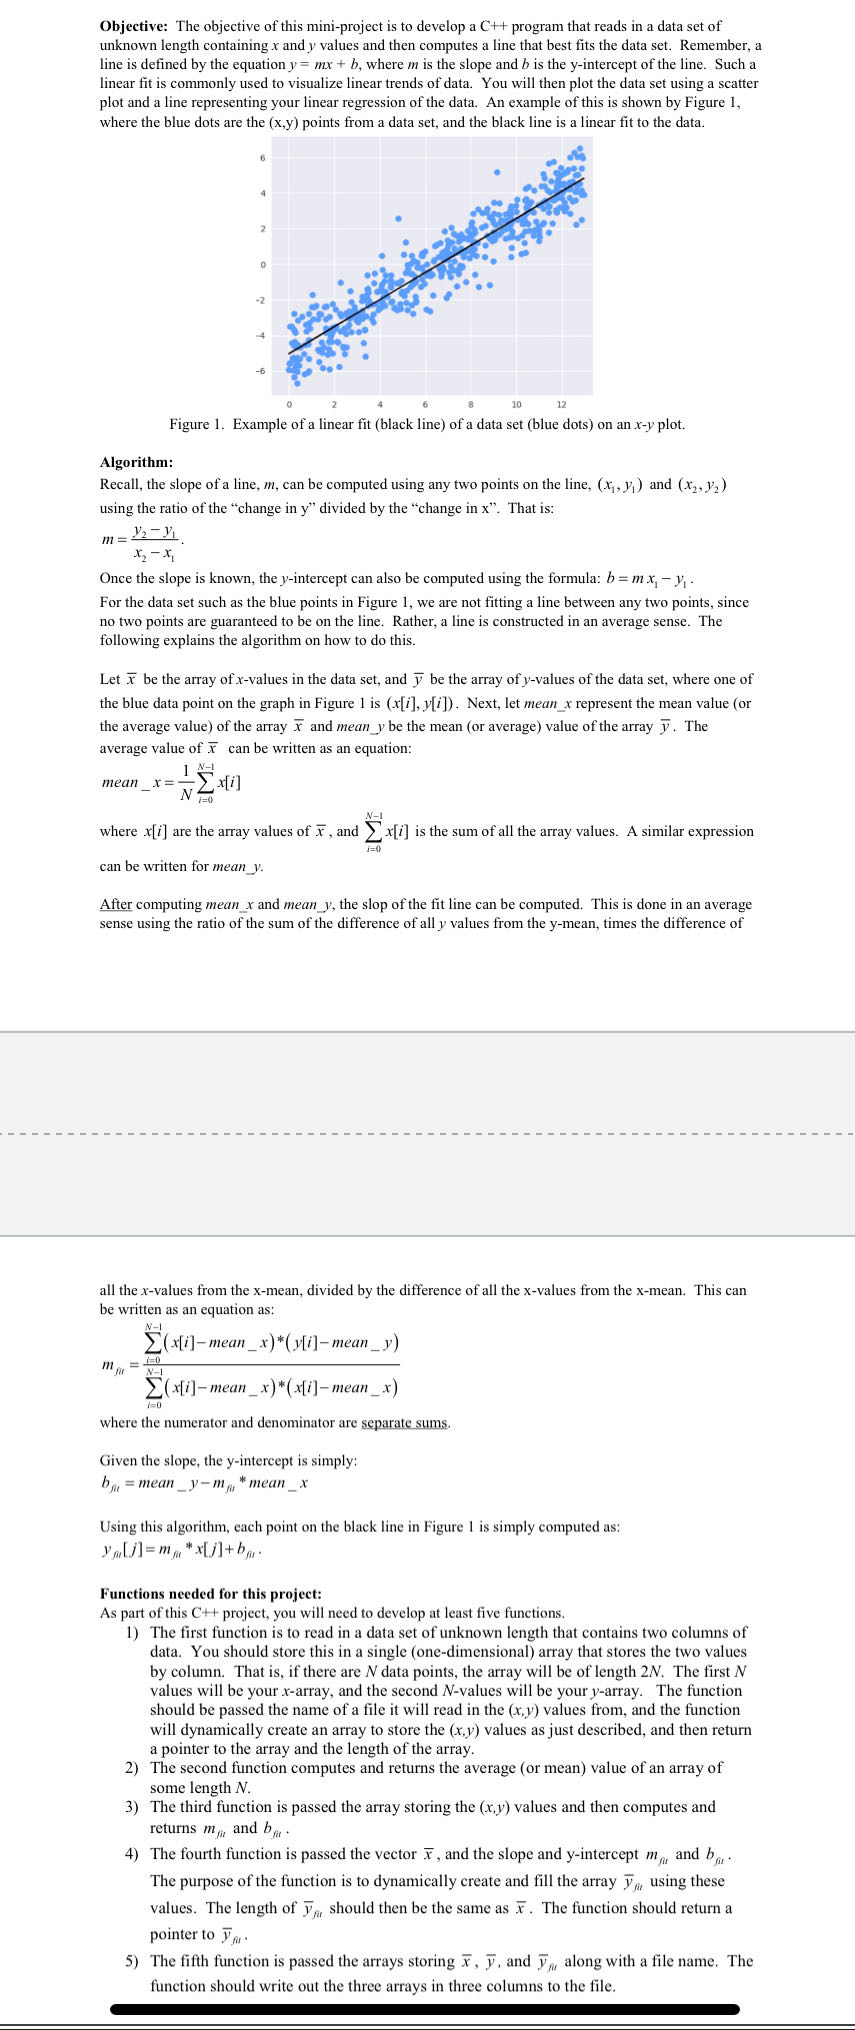
plot and a line representing your linear regression of the data. An example of this is shown by Figure
where the blue dots are the points from a data set, and the black line is a linear fit to the data.
Figure Example of a linear fit black line of a data set blue dots on an plot.
Algorithm:
Recall, the slope of a line, can be computed using any two points on the line, and
using the ratio of the "change in divided by the "change in That is:
Once the slope is known, the intercept can also be computed using the formula:
For the data set such as the blue points in Figure we are not fitting a line between any two points, since
no two points are guaranteed to be on the line. Rather, a line is constructed in an average sense. The
following explains the algorithm on how to do this.
Let be the array of values in the data set, and be the array of values of the data set, where one of
the blue data point on the graph in Figure is Next, let mean represent the mean value or
the average value of the array and mean be the mean or average value of the array The
average value of can be written as an equation:
mean
where are the array values of and is the sum of all the array values. A similar expression
can be written for mean
After computing mean and mean the slop of the fit line can be computed. This is done in an average
sense using the ratio of the sum of the difference of all values from the mean, times the difference of
all the values from the mean, divided by the difference of all the values from the mean. This can
be written as an equation as:
where the numerator and denominator are separate sums.
Given the slope, the yintercept is simply:
Using this algorithm, each point on the black line in Figure is simply computed as:
Functions needed for this project:
As part of this C project, you will need to develop at least five functions.
The first function is to read in a data set of unknown length that contains two columns of
data. You should store this in a single onedimensional array that stores the two values
by column. That is if there are data points, the array will be of length The first
values will be your array, and the second values will be your array. The function
should be passed the name of a file it will read in the values from, and the function
will dynamically create an array to store the values as just described, and then return
a pointer to the array and the length of the array.
The second function computes and returns the average or mean value of an array of
some length
The third function is passed the array storing the
Step by Step Solution
There are 3 Steps involved in it
1 Expert Approved Answer
Step: 1 Unlock

Question Has Been Solved by an Expert!
Get step-by-step solutions from verified subject matter experts
Step: 2 Unlock
Step: 3 Unlock