

Question: using Matlab I need a basic idea about the format of this program One way that MATLAB can be used is for data analysis. One
using Matlab I need a basic idea about the format of this program
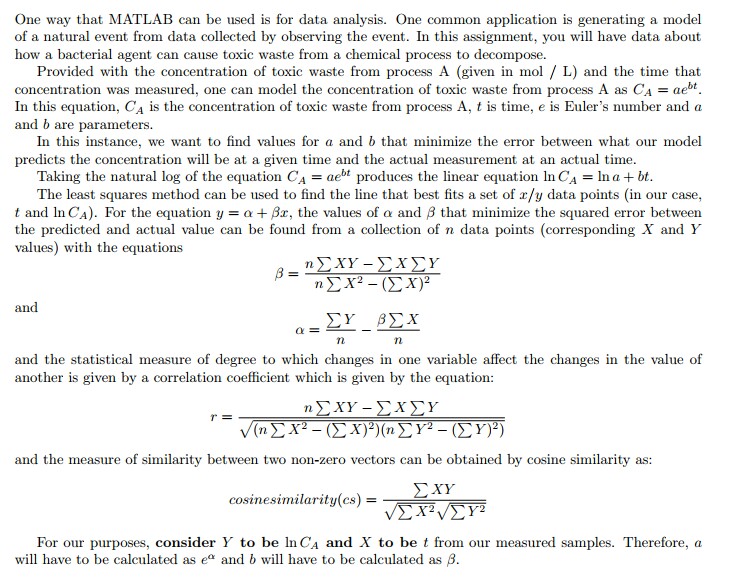
One way that MATLAB can be used is for data analysis. One common application is generating a model of a natural event from data collected by observing the event. In this assignment, you will have data about how a bacterial agent can cause toxic waste from a chemical process to decompose. Provided with the concentration of toxic waste from process A (given in mol / L) and the time that concentration was measured, one can model the concentration of toxic waste from process A as CAaebt In this equation, CA is the concentration of toxic waste from process and b are parameters A, t is time, e is Euler's number and a In this instance, we want to find values for a and b that minimize the error between what our model predicts the concentration will be at a given time and the actual measurement at an actual time Taking the natural log of the equation CA aebt produces the linear equation InCA In a bt The least squares method can be used to find the line that best fits a set of r/y data points (in our case, t and In CA). For the equation y = +82, the values of and that minimize the squared error between the predicted and actual value can be found from a collection of n data points (corresponding X and Y values) with the equations n 'Y-- and and the statistical measure of degree to which changes in one variable affect the changes in the value of another is given by a correlation coefficient which is given by the equation: and the measure of similarity between two non-zero vectors can be obtained by cosine similarity as Xy. cosinesimilarity(cs) For our purposes, consider Y to be In CA and X to be t from our measured samples. Therefore, a will have to be calculated as ea and b will have to be calculated as One way that MATLAB can be used is for data analysis. One common application is generating a model of a natural event from data collected by observing the event. In this assignment, you will have data about how a bacterial agent can cause toxic waste from a chemical process to decompose. Provided with the concentration of toxic waste from process A (given in mol / L) and the time that concentration was measured, one can model the concentration of toxic waste from process A as CAaebt In this equation, CA is the concentration of toxic waste from process and b are parameters A, t is time, e is Euler's number and a In this instance, we want to find values for a and b that minimize the error between what our model predicts the concentration will be at a given time and the actual measurement at an actual time Taking the natural log of the equation CA aebt produces the linear equation InCA In a bt The least squares method can be used to find the line that best fits a set of r/y data points (in our case, t and In CA). For the equation y = +82, the values of and that minimize the squared error between the predicted and actual value can be found from a collection of n data points (corresponding X and Y values) with the equations n 'Y-- and and the statistical measure of degree to which changes in one variable affect the changes in the value of another is given by a correlation coefficient which is given by the equation: and the measure of similarity between two non-zero vectors can be obtained by cosine similarity as Xy. cosinesimilarity(cs) For our purposes, consider Y to be In CA and X to be t from our measured samples. Therefore, a will have to be calculated as ea and b will have to be calculated as
Step by Step Solution
There are 3 Steps involved in it

Get step-by-step solutions from verified subject matter experts