

Question: Upload File or can add clear full screen-shots instead , But no Pictures from mobile please Q.4. You are an intern with an equity research
Upload File or can add clear full screen-shots instead , But no Pictures from mobile please
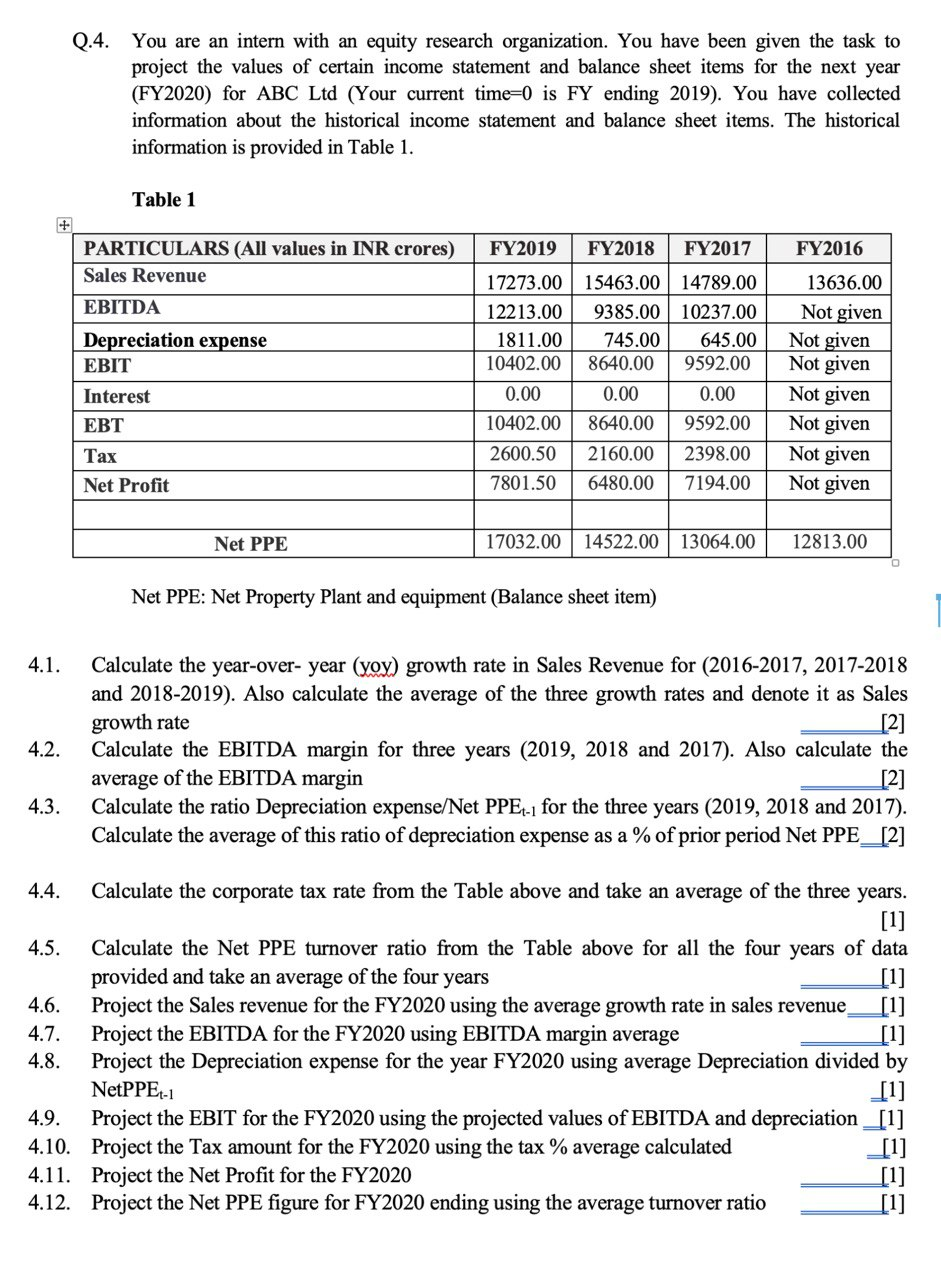
Q.4. You are an intern with an equity research organization. You have been given the task to project the values of certain income statement and balance sheet items for the next year (FY2020) for ABC Ltd (Your current time=0 is FY ending 2019). You have collected information about the historical income statement and balance sheet items. The historical information is provided in Table 1. Table 1 FY2016 PARTICULARS (All values in INR crores) Sales Revenue EBITDA Depreciation expense EBIT Interest Tax Net Profit FY2019 FY2018 FY2017 17273.00 15463.00 14789.00 12213.00 9385.00 10237.00 1811.00 745.00 645.00 10402.00 8640.00 9592.00 0.00 0.00 0.00 10402.00 8640.00 9592.00 2600.50 2160.00 2398.00 7801.50 6480.00 7194.00 13636.00 Not given Not given Not given Not given Not given Not given Not given Net PPE 17032.00 14522.00 13064.00 12813.00 Net PPE: Net Property Plant and equipment (Balance sheet item) 4.1. 4.2. Calculate the year-over- year (yoy) growth rate in Sales Revenue for (2016-2017, 2017-2018 and 2018-2019). Also calculate the average of the three growth rates and denote it as Sales growth rate [2] Calculate the EBITDA margin for three years (2019, 2018 and 2017). Also calculate the average of the EBITDA margin [2] Calculate the ratio Depreciation expense/Net PPE -1 for the three years (2019, 2018 and 2017). Calculate the average of this ratio of depreciation expense as a % of prior period Net PPE_[2] 4.3. 4.4. Calculate the corporate tax rate from the Table above and take an average of the three years. [1] 4.5. Calculate the Net PPE turnover ratio from the Table above for all the four years of data provided and take an average of the four years [1] 4.6. Project the Sales revenue for the FY2020 using the average growth rate in sales revenue 4.7. Project the EBITDA for the FY2020 using EBITDA margin average 4.8. Project the Depreciation expense for the year FY2020 using average Depreciation divided by NetPPER-1 [1] 4.9. Project the EBIT for the FY2020 using the projected values of EBITDA and depreciation_[i] 4.10. Project the Tax amount for the FY2020 using the tax % average calculated [1] 4.11. Project the Net Profit for the FY2020 4.12. Project the Net PPE figure for FY2020 ending using the average turnover ratio [1]
Step by Step Solution
There are 3 Steps involved in it

Get step-by-step solutions from verified subject matter experts