

Question: Upload Tornado data and make a correlation table consisting of ALL 12 months. Use only the Tornados per month columns. Answer the questions: I) Which
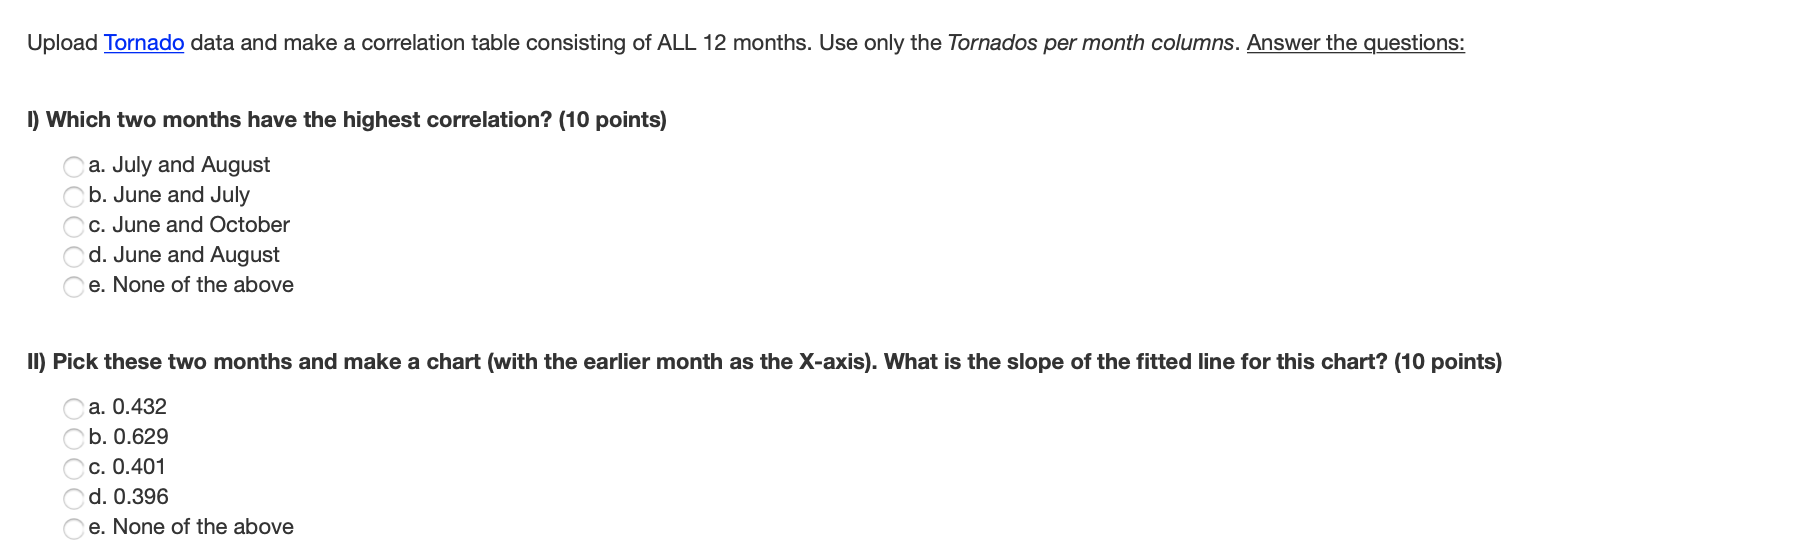
Upload Tornado data and make a correlation table consisting of ALL 12 months. Use only the Tornados per month columns. Answer the questions: I) Which two months have the highest correlation? (10 points) "' a. July and August "' b. June and July \"' c. June and October "' d. June and August "' e. None of the above ll) Pick these two months and make a chart (with the eariier month as the X-axis). What is the slope of the fitted line for this chart? (10 points) \"' a. 0.432 "' b. 0.629 "' c. 0.401 \"' d. 0.396 "' e. None of the above
Step by Step Solution
There are 3 Steps involved in it
1 Expert Approved Answer
Step: 1 Unlock

Question Has Been Solved by an Expert!
Get step-by-step solutions from verified subject matter experts
Step: 2 Unlock
Step: 3 Unlock