

Question: upper and lower control limits & control limits for 3-sigma R-charts?? Refer to Table S6.1 - Factors for Computing Control Chart Limits ( 3 sigma)
upper and lower control limits & control limits for 3-sigma R-charts?? 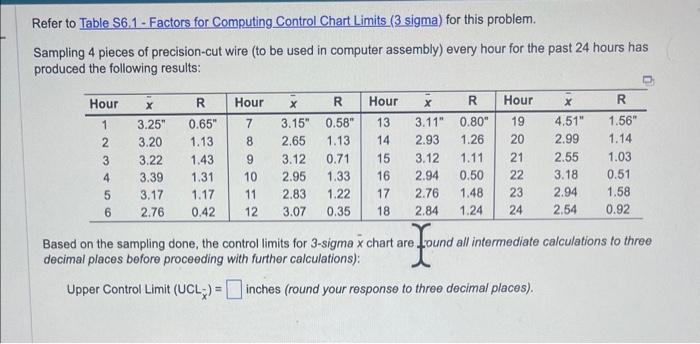
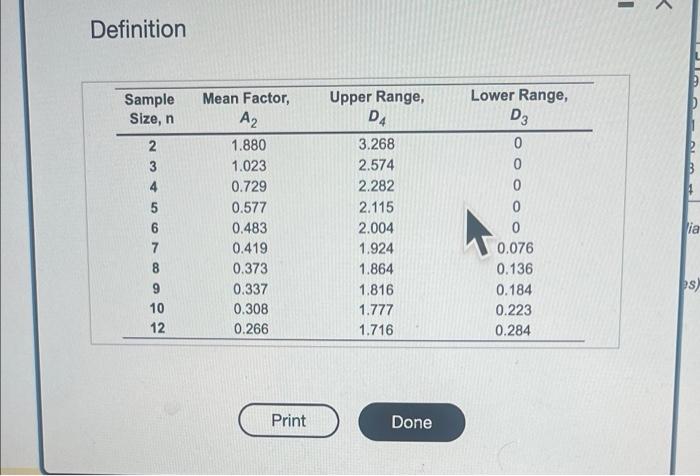
Refer to Table S6.1 - Factors for Computing Control Chart Limits ( 3 sigma) for this problem. Sampling 4 pieces of precision-cut wire (to be used in computer assembly) every hour for the past 24 hours has produced the following results: Based on the sampling done, the control limits for 3 -sigma x chart are found all intermediate calculations to three decimal places before proceeding with further calculations): Upper Control Limit (UCLx)= inches (round your response to three decimal places). Definition
Step by Step Solution
There are 3 Steps involved in it
1 Expert Approved Answer
Step: 1 Unlock

Question Has Been Solved by an Expert!
Get step-by-step solutions from verified subject matter experts
Step: 2 Unlock
Step: 3 Unlock