

Question: with z= 3 what are the upper and lower control limits for the mean chart? Reler to Tabke S6,1 - Factors for Computing Control Chart
with z= 3 what are the upper and lower control limits for the mean chart? 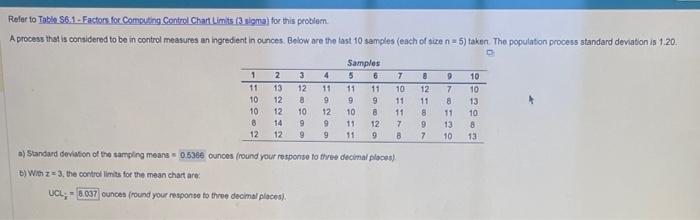
Reler to Tabke S6,1 - Factors for Computing Control Chart Limis (3 yigma) for this probtem. A process that is considered to be in control measures an ingredient in ounces. Below are the tast 10 samples (each of sice n=5 ) taken. The populaton process standard deviation is 1.20. a) Standard doviation of the sarroting means a cunces (round your response to three decimal ploces) b) With z=3, the control limits for the mean chart are: UCL:= ounces (round your response to three decimal ploces)
Step by Step Solution
There are 3 Steps involved in it
1 Expert Approved Answer
Step: 1 Unlock

Question Has Been Solved by an Expert!
Get step-by-step solutions from verified subject matter experts
Step: 2 Unlock
Step: 3 Unlock