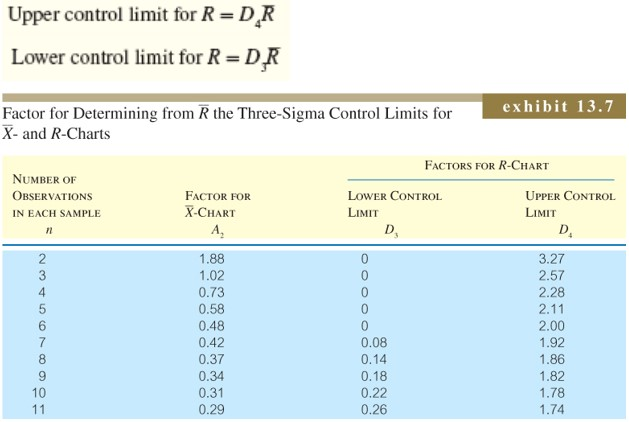
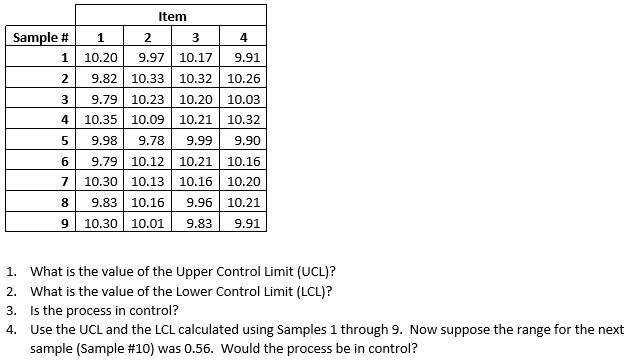
Question: Upper control limit for R=D.R Lower control limit for R=DR n A Factor for Determining from R the Three-Sigma Control Limits for exhibit 13.7 X-

Upper control limit for R=D.R Lower control limit

Upper control limit for R=D.R Lower control limit

Upper control limit for R=D.R Lower control limit for R=DR n A Factor for Determining from R the Three-Sigma Control Limits for exhibit 13.7 X- and R-Charts FACTORS FOR R-CHART NUMBER OF OBSERVATIONS FACTOR FOR LOWER CONTROL UPPER CONTROL IN EACH SAMPLE X-CHART LIMIT LIMIT D D 2 1.88 3.27 3 1.02 2.57 4 0.73 2.28 5 0.58 0 2.11 6 0.48 0 2.00 7 0.42 0.08 1.92 8 0.37 0.14 1.86 9 0.34 0.18 1.82 10 0.31 0.22 1.78 11 0.29 0.26 1.74 0 0 Item 1 2 3 4 Sample # 1 WIN 5 10.20 9.97 10.17 9.91 9.82 10.33 10.32 10.26 9.79 10.23 10.20 10.03 10.35 10.09 10.21 10.32 9.98 9.78 9.99 9.90 9.79 10.12 10.21 10.16 10.30 10.13 10.16 10.20 9.83 10.16 9.96 10.21 10.30 10.01 9.83 9.91 6 7 8 9 1. What is the value of the Upper Control Limit (UCL)? 2. What is the value of the Lower Control Limit (LCL)? 3. Is the process in control? 4. Use the UCL and the LCL calculated using Samples 1 through 9. Now suppose the range for the next sample (Sample #10) was 0.56. Would the process be in control

Step by Step Solution

There are 3 Steps involved in it

1 Expert Approved Answer
Step: 1 Unlock blur-text-image
Question Has Been Solved by an Expert!

Get step-by-step solutions from verified subject matter experts

Step: 2 Unlock
Step: 3 Unlock

Students Have Also Explored These Related General Management Questions!