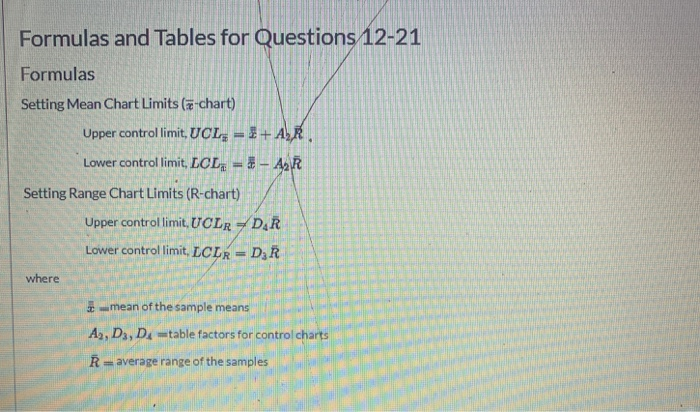
Question: Formulas and Tables for Questions 12-21 Formulas Setting Mean Chart Limits (e-chart) Upper controllimit.UCL, = + AR Lower controllimit, LCL, - - AR Setting Range

Formulas and Tables for Questions 12-21 Formulas
Formulas and Tables for Questions 12-21 Formulas Setting Mean Chart Limits (e-chart) Upper controllimit.UCL, = + AR Lower controllimit, LCL, - - AR Setting Range Chart Limits (R-chart) Upper control limit, UCLR DAR Lower control limit, LCLR=D;R Personel where the din * -mean of the sample means A2, D3, D =table factors for control charts - average range of the samples we factors Tables Table 1. Factors for Computing Control Chart Limits (3 sigma) SAMPLE SIZE, MEAN FACTORA UPPER RANGE, DA LOWER RANGE, D, 1.880 3.268 0.000 1.023 2.574 0.000 0.729 2.282 0.000 0.577 2.115 0.000 0.483 2004 0.000 0.419 1924 0.076 0.373 1.864 0.136 0.337 1816 0.184 0.308 1777 0.223 0266 1716 0.284 Table 2. Bottle diameter (mm) Observation Sample 1 Sample 2 Sample 3 Sample 4 Sample 5 Sample 6 24 1/ 22 ZE 2020 20 21 2. 1 22 NNN 2020 22 19 21 62 19 21 2020 18 20 20 20 1 21 20 Average 20.92 20.67 23.08 19.75 20.83 20.75 Question 12 Based on Table 2, what is the average range? o 1 02 12 20 06 D Question 13 Based on Table 2, what is the sample size n? o 10 o 21 6 07 12 Question 14 / Based on Tables 1 and 2 what are the statistical process control limits for the chart for bottle diameter? Lower Control Limit for-chart = 18.95 and Upper Control Limit for-chart = 23.05 Lower Control Limit for-chart = 20.47 and Upper Control Limit for-chart = 21.53 o Lower Control Limit for chart = 17.24 and Upper control Limit for-chart - 24.76 o Lower Control Limit for-chart = 19.54 and Upper Control Limit for-chart-2246 o Lower Control Limit for chart = 20.03 and Upper Control Limit for-chart -21.97 D Question 15 Based on Tables 1 and 2 which of the following sample ranges is an outlier on the R-chart for bottle diameter? None of the sample ranges is an outlier on the R-chart for bottle diameter Sample 4 range, R. Sample 3 range, RS Sample 6 range. R Sample 2 range, Question 16 Based on Tables 1 and 2, which of the following statements is true? There are five or more sample averages above the rean. There are five or more sample averages increasing in a row. There are five or more sample ranges above the mean There are five or more sample ranges below the mean. There are five or more sample averages below the mean. Question 17 Based on Tables 1 and 2, which of the following sample averages is an outlier on the chart for bottle diameter? Sample 5 averages Sample 4 average. Sample 1 average 1 None of the sample averages is an outlier on the-chart for bottle diameter Sample 2 average 2 ) Question 18 Based on Tables 1 and 2, which of the following statements is true? The operations manager should stop collecting the data in Table 2 to lower inspection costs. The operations manager should look for assignable causes for the variation in bottle diameter. The operations manager should decrease the sample size. o The operations manager should recognize that variation in bottle diameter is only due to random causes. The operations manager should decrease the number of samples. Question 19 Based on Table 2, what is the mean of the sample means? 0 & 0 0 0 Question 20 Based on Tables 1 and 2, what are the statistical process control limits for the R-chart for bottle diameter? o Lower Control Limit for R-chart=0 and Upper Control Limit for R-chart = 6.54 O Lower Control Limit for R-chart=0 and Upper Cntrol Limit for R-chart = 4.56 o Lower Control Limit for R-chart = 0 and Upper Control Limit for R-chart = 401 o Lower Control Limit for R-chart=0.568 and Upper Control Limit for R-chart = 3.43 o Lower Control Limit for R-chart = 0 and Upper Control Limit for R-chart = 5.15 Question 21 Based on Tables 1 and 2 which of the following statements is true? The bottle diameter conforms to the customer specifications The bottle diameter has only 3.4 defects per million (360). The bottle diameter is unstable and unpredictable The bottle diameter is in control The bottle diameter has zero defects

Step by Step Solution

There are 3 Steps involved in it

1 Expert Approved Answer
Step: 1 Unlock blur-text-image
Question Has Been Solved by an Expert!

Get step-by-step solutions from verified subject matter experts

Step: 2 Unlock
Step: 3 Unlock

Students Have Also Explored These Related General Management Questions!