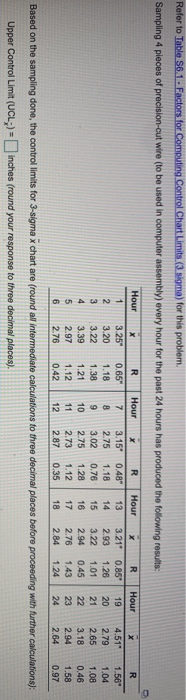
Question: upper control limit? lower control limit? out of control? R Chart UCL? LCL? out of control? Refer to Table S6.1. Factors for Computing Control Chart

upper control limit? lower control limit? out of
upper control limit?
lower control limit?
out of control?
R Chart
UCL?
LCL?
out of control?
Refer to Table S6.1. Factors for Computing Control Chart Limits (3 sigma) for this problem. Sampling 4 pieces of precision-cut wire to be used in computer assembly) every hour for the past 24 hours has produced the following results: Hour x 3.25" 3.20 3.22 3.39 2.97 2.76 R 0.65" 1.18 1.38 1.21 1.12 0.42 Hour X 7 3.15* 8 2.75 9 3.02 2.75 2.73 R 0.48" 1.18 0.76 1.28 1.12 Hour 13 14 15 16 17 18 X 3.21" 2.93 3.22 2.94 2.76 2.84 R Hour X 0.85 19 4.51 1.28 20 2.79 1.0121 2.65 0.45 22 3.18 143 23 2.94 1.24 2 4 2.64 R 1.56" 1.04 1.08 0.46 1.58 0.97 Based on the sampling done, the control limits for 3-sigma x chart are (round all intermediate calculations to three decimal places before proceeding with further calculations): Upper Control Limit (UCL;) - inches (round your response to three decimal places)

Step by Step Solution

There are 3 Steps involved in it

1 Expert Approved Answer
Step: 1 Unlock blur-text-image
Question Has Been Solved by an Expert!

Get step-by-step solutions from verified subject matter experts

Step: 2 Unlock
Step: 3 Unlock

Students Have Also Explored These Related General Management Questions!