

Question: The following are quality control data for a manufacturing process at Kensport Chemical Company. The data show the temperature in degrees centigrade at five points
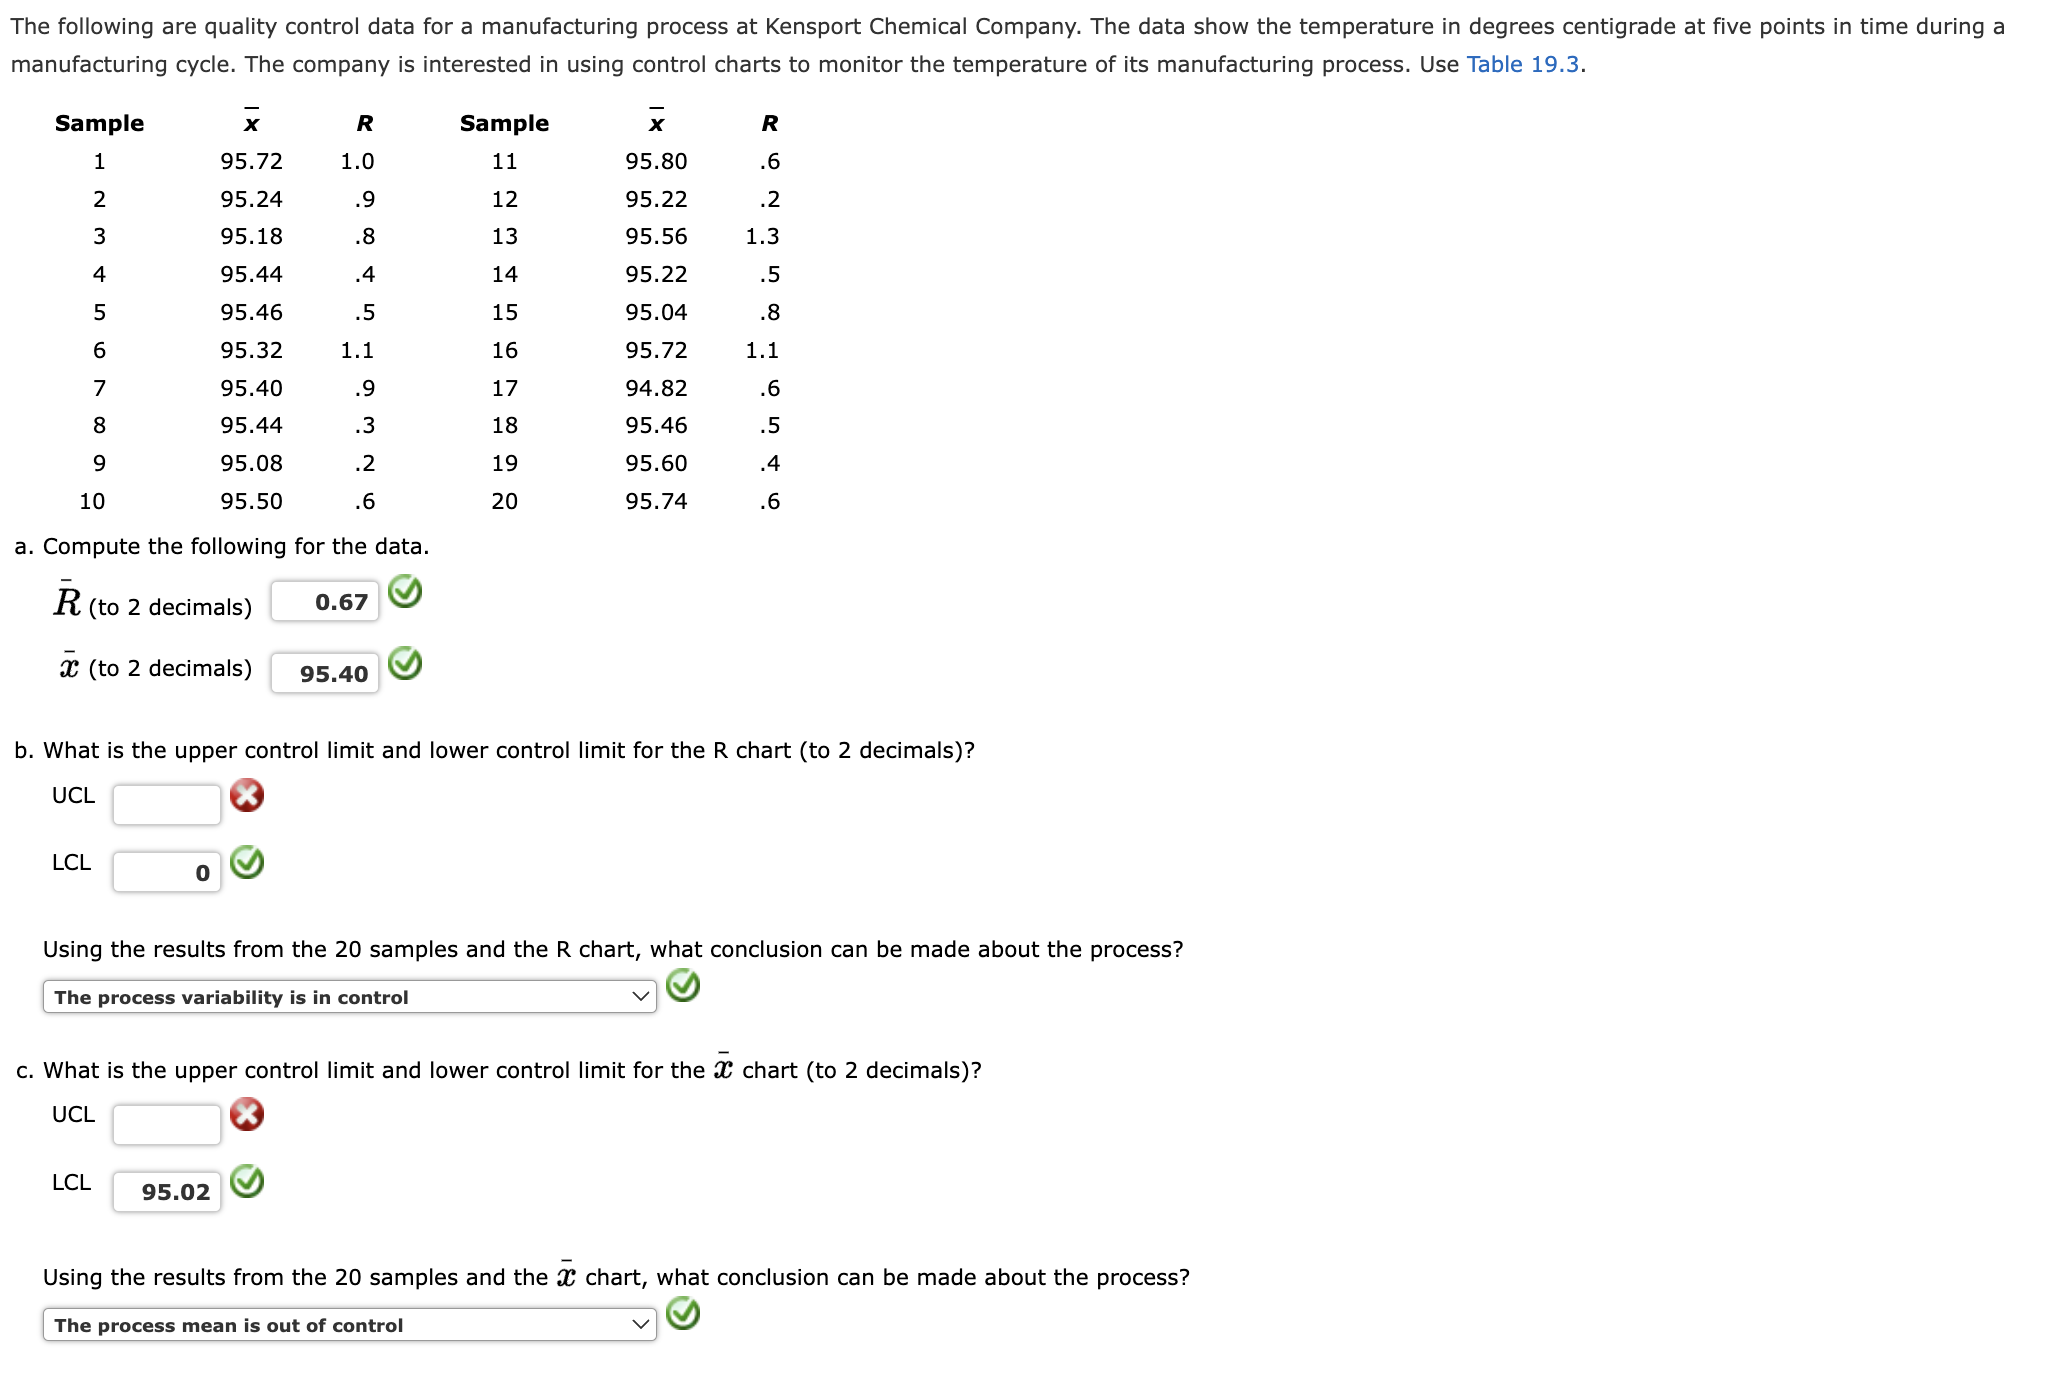
The following are quality control data for a manufacturing process at Kensport Chemical Company. The data show the temperature in degrees centigrade at five points in time during a manufacturing cycle. The company is interested in using control charts to monitor the temperature of its manufacturing process. Use Table The following are quality control data for a manufacturing process at Kensport Chemical Company. The data show the temperature in degrees centigrade at five points in time during a
manufacturing cycle. The company is interested in using control charts to monitor the temperature of its manufacturing process. Use Table
a Compute the following for the data.
decimals
decimals
b What is the upper control limit and lower control limit for the chart to decimals
UCL
LCL
Using the results from the samples and the chart, what conclusion can be made about the process?
The process variability is in control
c What is the upper control limit and lower control limit for the chart to decimals
UCL
LCL
Using the results from the samples and the chart, what conclusion can be made about the process?
The process mean is out of control
Step by Step Solution
There are 3 Steps involved in it
1 Expert Approved Answer
Step: 1 Unlock

Question Has Been Solved by an Expert!
Get step-by-step solutions from verified subject matter experts
Step: 2 Unlock
Step: 3 Unlock