

Question: URGENT HELP NEEDED Below is my code for a graph from a text file. I want to find the area under the curve, can anyone
URGENT HELP NEEDED
Below is my code for a graph from a text file. I want to find the area under the curve, can anyone give me sample code to do this considering it's a text file?
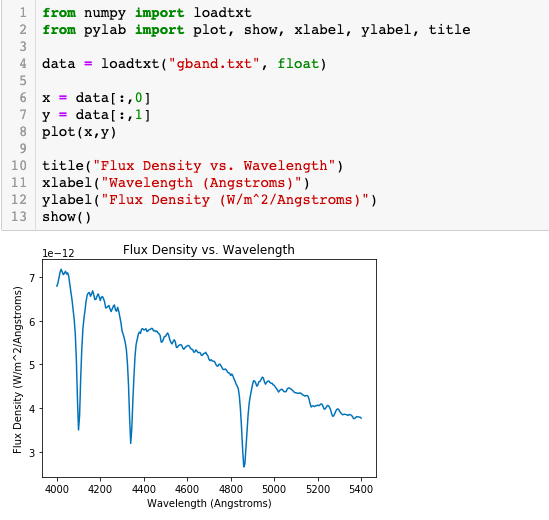
from numpy import loadtxt 2 from pylab import plot, show, xlabel, ylabel, title DOWN 4 data = loadtxt("gband.txt", float) 6 x = data[:,0] 7 y = data[:,1] 8 plot(x,y) 10 title("Flux Density vs. Wavelength") 11 xlabel("Wavelength (Angstroms)") 12 ylabel("Flux Density (W/m^2/Angstroms)") 13 show() le-12 Flux Density vs. Wavelength Flux Density (W/m2/Angstroms) 4000 4200 4400 4600 4800 5000 Wavelength (Angstroms) 5200 5400
Step by Step Solution
There are 3 Steps involved in it
1 Expert Approved Answer
Step: 1 Unlock

Question Has Been Solved by an Expert!
Get step-by-step solutions from verified subject matter experts
Step: 2 Unlock
Step: 3 Unlock