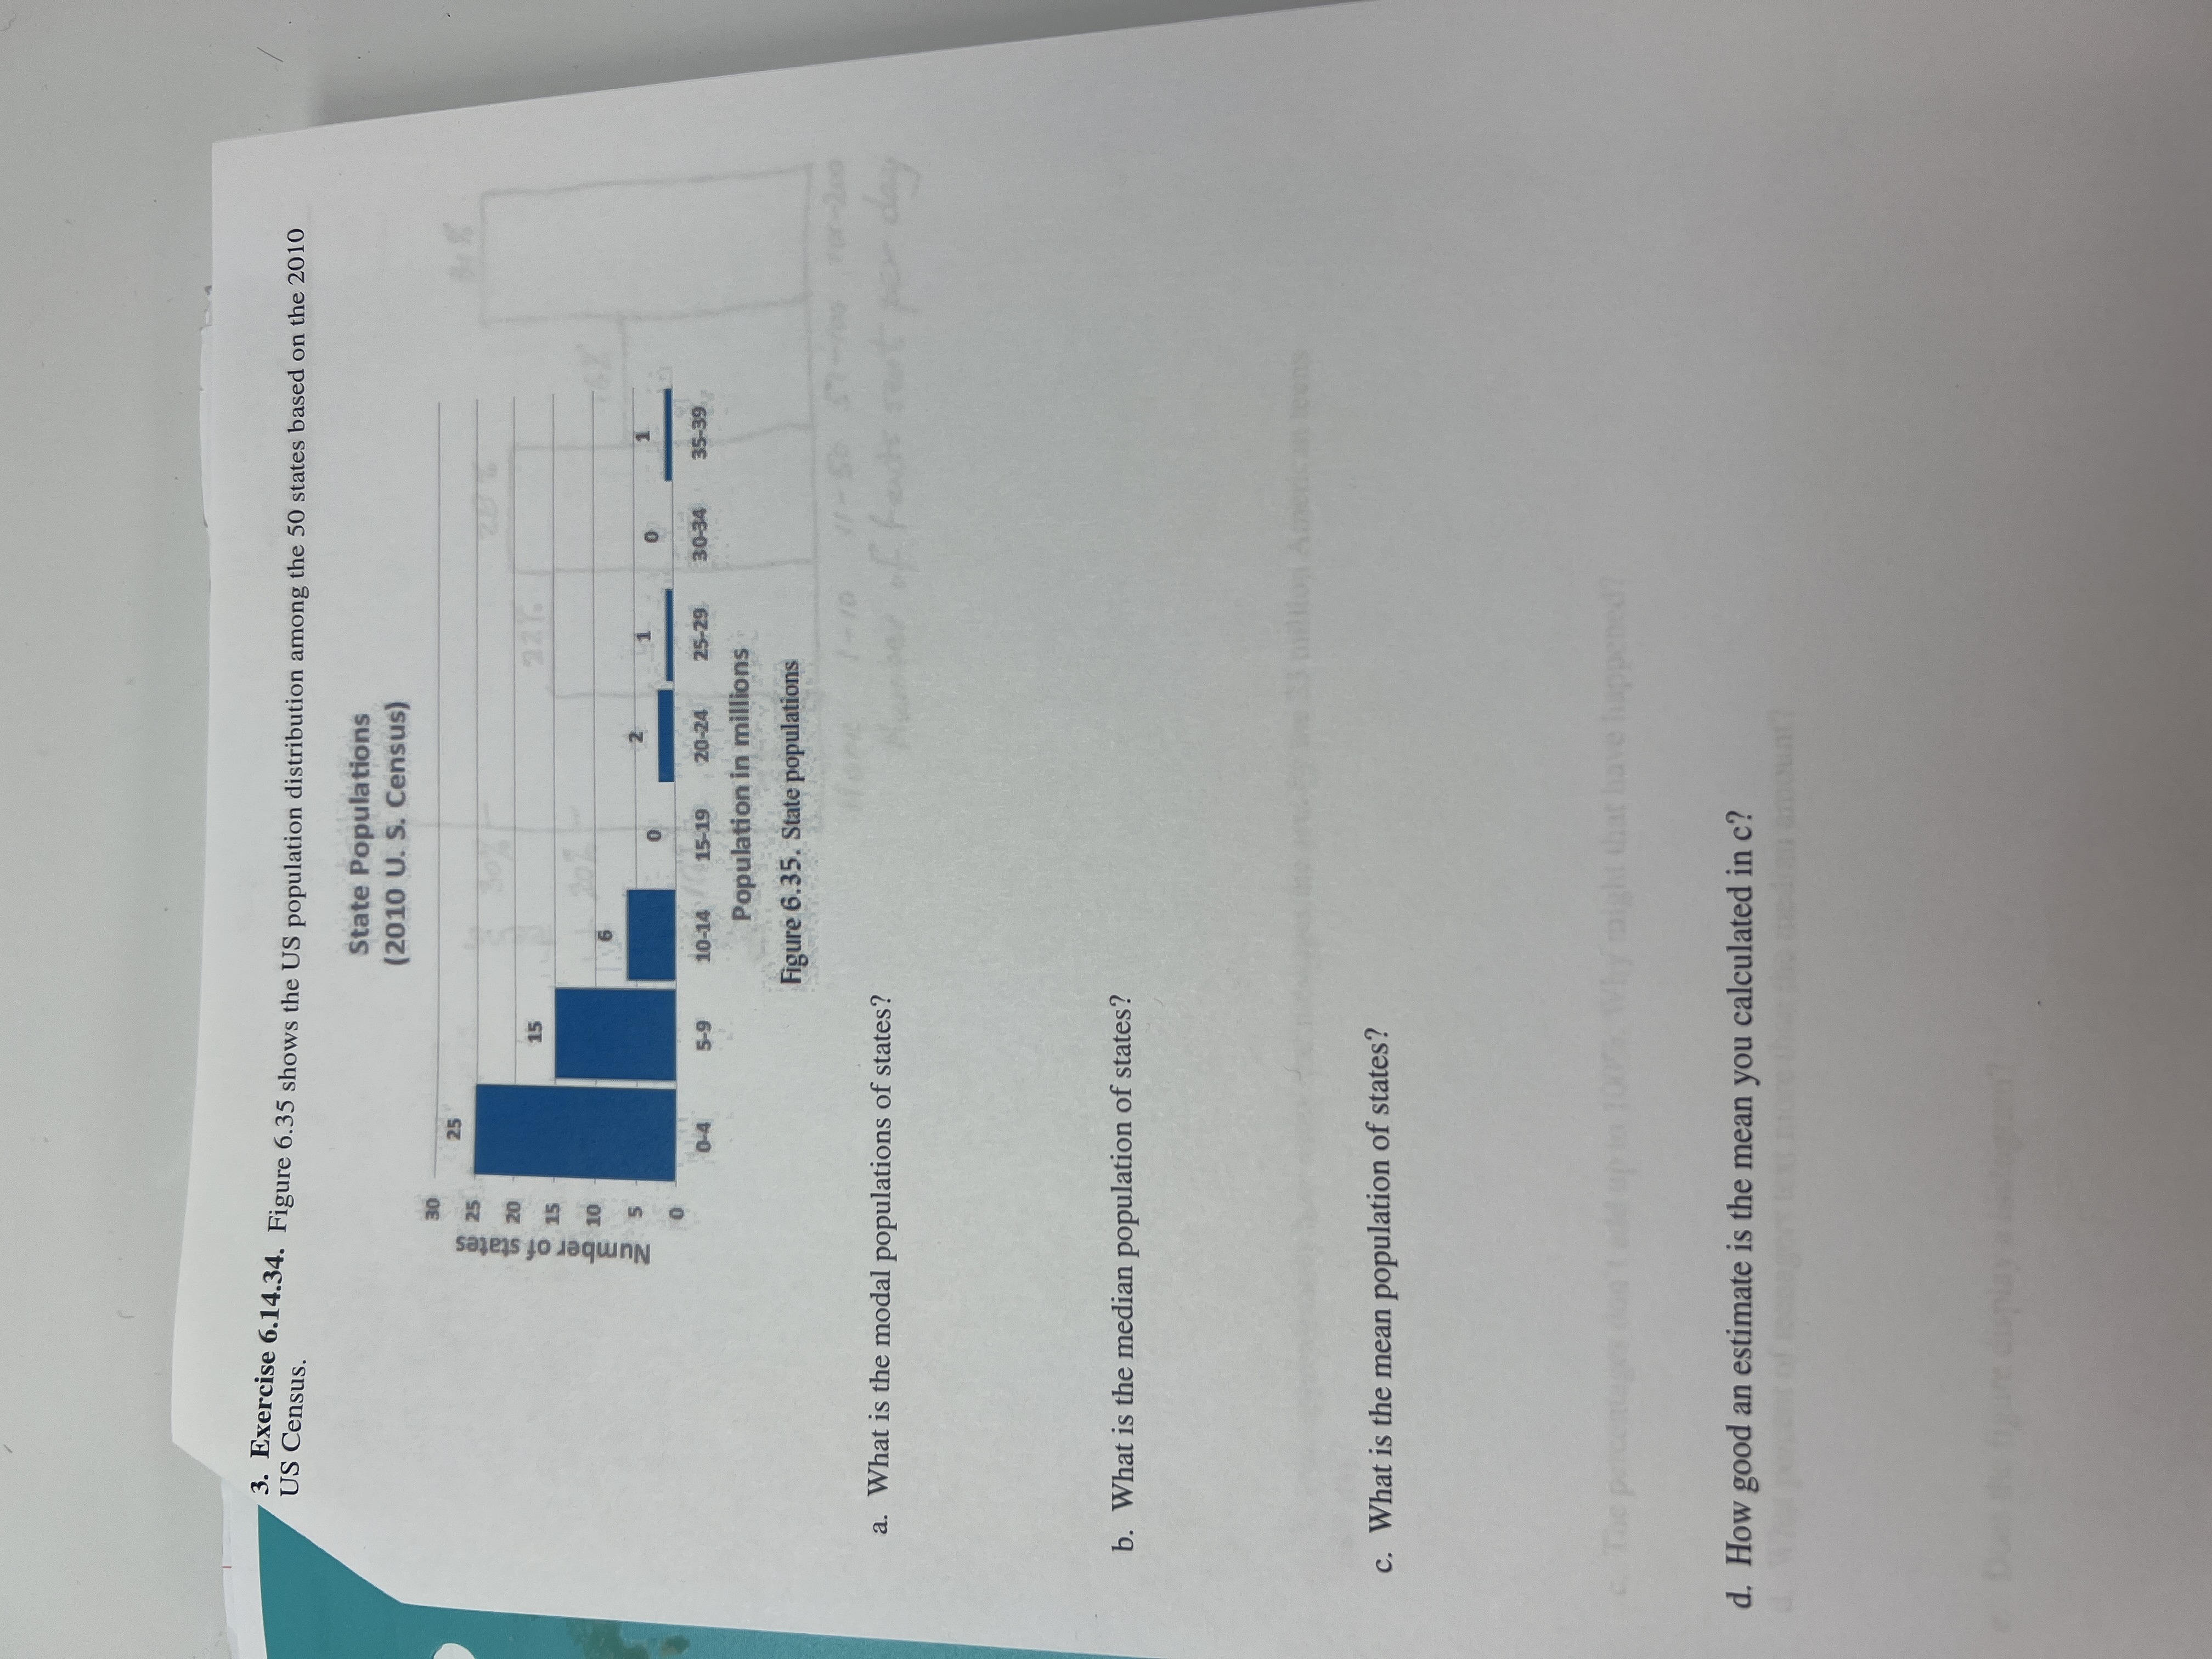
Question: US Census. 3. Exercise 6.14.34. Figure 6.35 shows the US population distribution among the 50 states based on the 2010 State Populations (2010 U. S.

US Census. 3. Exercise 6.14.34. Figure 6.35 shows
US Census. 3. Exercise 6.14.34. Figure 6.35 shows the US population distribution among the 50 states based on the 2010 State Populations (2010 U. S. Census) 30 25 15 Number of states 0-4 5-9 10-14 15-19 20-24 25-29 30-34 35-39 Population in millions Figure 6.35. State populations a. What is the modal populations of states? b. What is the median population of states? c. What is the mean population of states? Why might that have happened d. How good an estimate is the mean you calculated in c

Step by Step Solution

There are 3 Steps involved in it

1 Expert Approved Answer
Step: 1 Unlock blur-text-image
Question Has Been Solved by an Expert!

Get step-by-step solutions from verified subject matter experts

Step: 2 Unlock
Step: 3 Unlock

Students Have Also Explored These Related Mathematics Questions!