

U.S. Civilian Labor Force (thousands) Year 2012 Year Labor Force Labor Force 2007 194,014 195,724 195,247...
Fantastic news! We've Found the answer you've been seeking!
Question:
Transcribed Image Text:
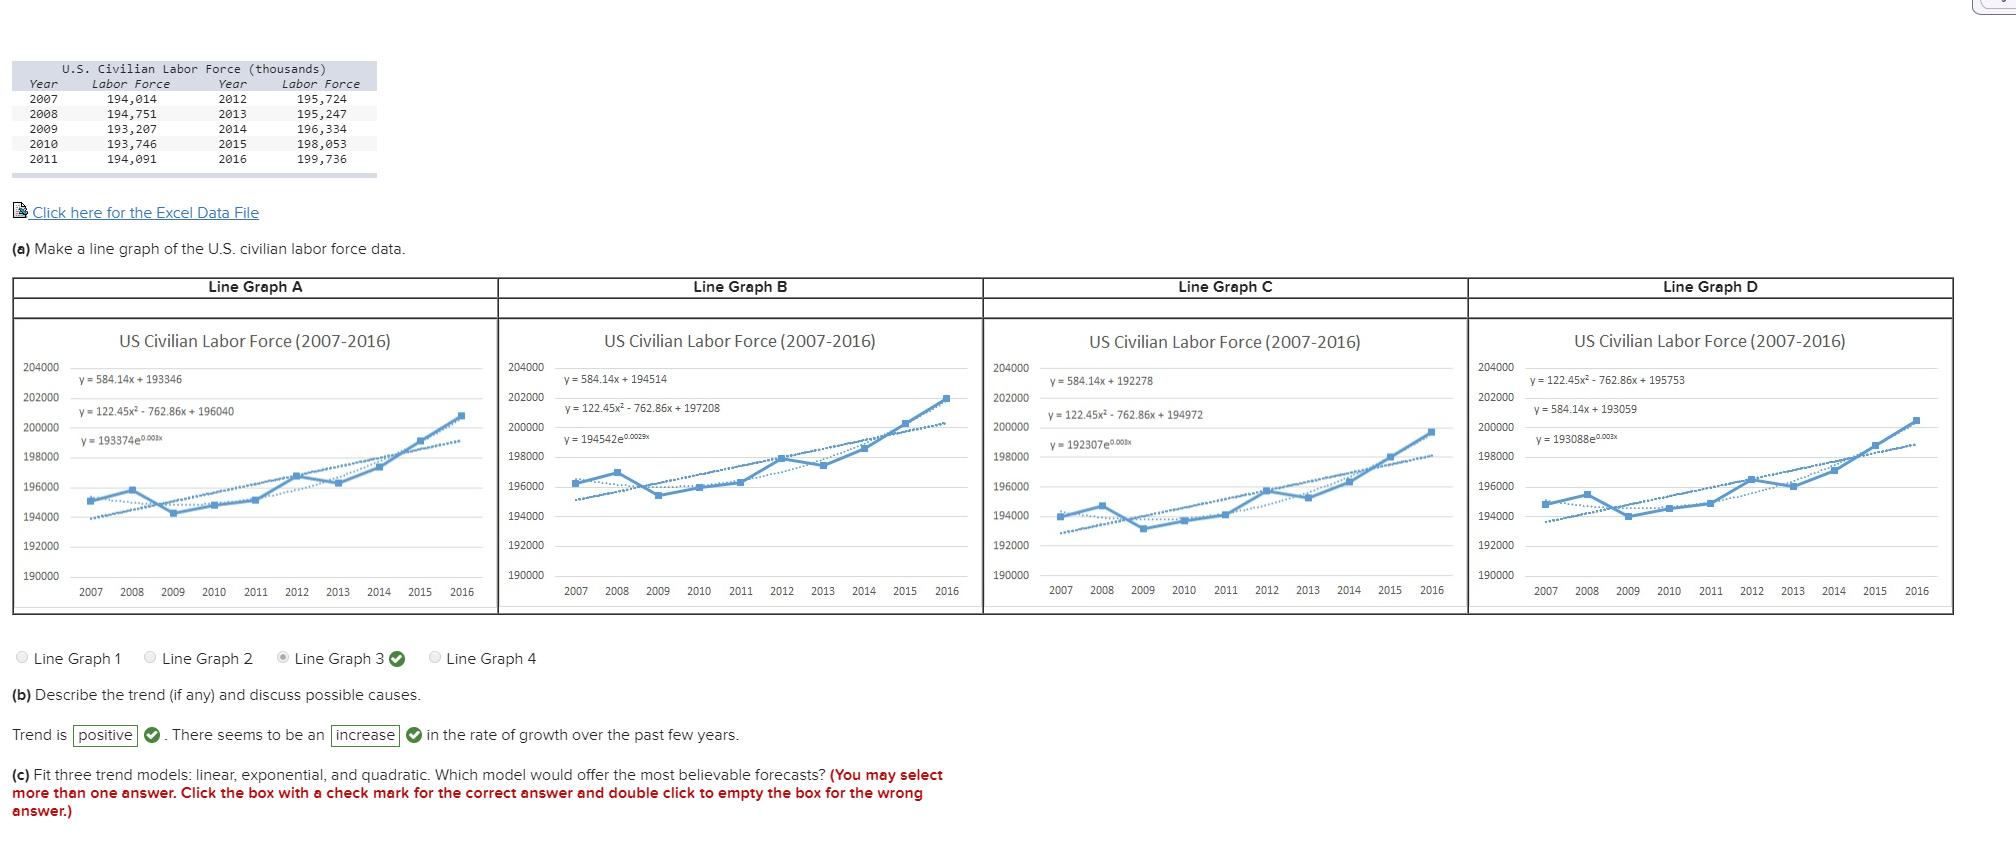
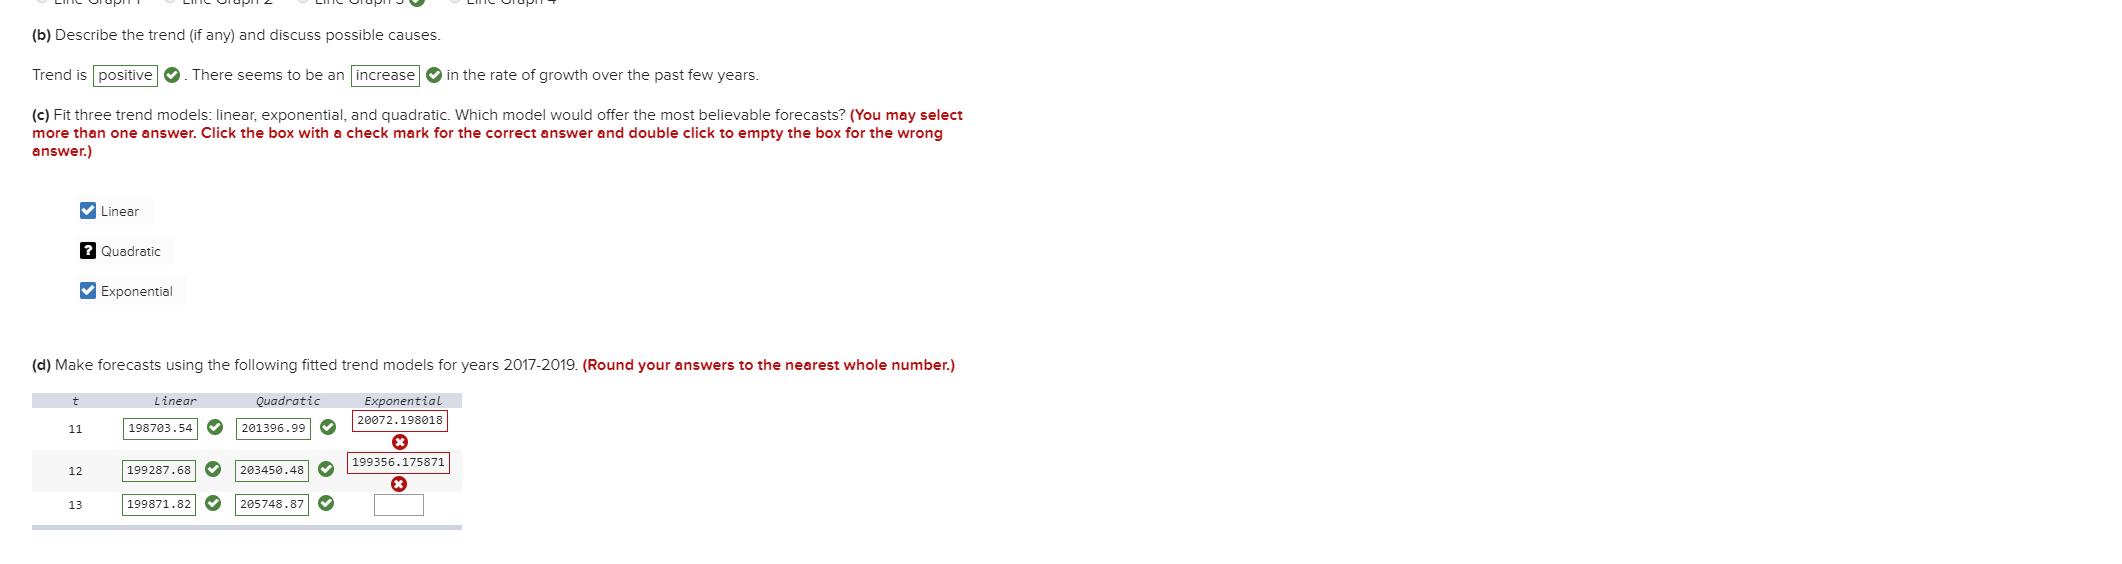
U.S. Civilian Labor Force (thousands) Year 2012 Year Labor Force Labor Force 2007 194,014 195,724 195,247 196,334 2008 194,751 2013 193, 207 193,746 194,091 2009 2014 2010 2015 198,053 199,736 2011 2016 E Click here for the Excel Data File (a) Make a line graph of the U.S. civilian labor force data. Line Graph A Line Graph B Line Graph C Line Graph D US Civilian Labor Force (2007-2016) US Civilian Labor Force (2007-2016) US Civilian Labor Force (2007-2016) US Civilian Labor Force (2007-2016) 204000 204000 204000 204000 y = 584.14x + 193346 y = 584.14x + 194514 y = 584.14x + 192278 y = 122.45x - 762.86x + 195753 202000 202000 202000 202000 y = 122.45x - 762.86x + 196040 y = 122.45x2 - 762.86x + 197208 y = 122.45x2 - 762.86x + 194972 y = 584.14x + 193059 200000 200000 200000 200000 y= 193374e0ax y= 194542e0002 y = 193088e0003. y= 192307e0N 198000 198000 198000 198000 196000 196000 196000 196000 194000 194000 194000 194000 192000 192000 192000 192000 190000 190000 190000 190000 2007 2008 2009 2010 2011 2012 2013 2014 2015 2016 2007 2008 2009 2010 2011 2012 2013 2014 2015 2016 2007 2008 2009 2010 2011 2012 2013 2014 2015 2016 2007 2008 2009 2010 2011 2012 2013 2014 2015 2016 O Line Graph 1 O Line Graph 2 O Line Graph 3 0 O Line Graph 4 (b) Describe the trend (if any) and discuss possible causes. Trend is positive O. There seems to be an increase O in the rate of growth over the past few years. (c) Fit three trend models: linear, exponential, and quadratic. Which model would offer the most believable forecasts? (You may select more than one answer. Click the box with a check mark for the correct answer and double click to empty the box for the wrong answer.) (b) Describe the trend (if any) and discuss possible causes. Trend is positive O. There seems to be an increase O in the rate of growth over the past few years. (c) Fit three trend models: linear, exponential, and quadratic. Which model would offer the most believable forecasts? (You may select more than one answer. Click the box with a check mark for the correct answer and double click to empty the box for the wrong answer.) V Linear ? Quadratic Exponential (d) Make forecasts using the following fitted trend models for years 2017-2019. (Round your answers to the nearest whole number.) Linear Quadratic Exponential 20072.198018 11 198703.54 O 201396.99 199356.175871 12 199287.68 |203450.48 13 199871.82 205748.87 U.S. Civilian Labor Force (thousands) Year 2012 Year Labor Force Labor Force 2007 194,014 195,724 195,247 196,334 2008 194,751 2013 193, 207 193,746 194,091 2009 2014 2010 2015 198,053 199,736 2011 2016 E Click here for the Excel Data File (a) Make a line graph of the U.S. civilian labor force data. Line Graph A Line Graph B Line Graph C Line Graph D US Civilian Labor Force (2007-2016) US Civilian Labor Force (2007-2016) US Civilian Labor Force (2007-2016) US Civilian Labor Force (2007-2016) 204000 204000 204000 204000 y = 584.14x + 193346 y = 584.14x + 194514 y = 584.14x + 192278 y = 122.45x - 762.86x + 195753 202000 202000 202000 202000 y = 122.45x - 762.86x + 196040 y = 122.45x2 - 762.86x + 197208 y = 122.45x2 - 762.86x + 194972 y = 584.14x + 193059 200000 200000 200000 200000 y= 193374e0ax y= 194542e0002 y = 193088e0003. y= 192307e0N 198000 198000 198000 198000 196000 196000 196000 196000 194000 194000 194000 194000 192000 192000 192000 192000 190000 190000 190000 190000 2007 2008 2009 2010 2011 2012 2013 2014 2015 2016 2007 2008 2009 2010 2011 2012 2013 2014 2015 2016 2007 2008 2009 2010 2011 2012 2013 2014 2015 2016 2007 2008 2009 2010 2011 2012 2013 2014 2015 2016 O Line Graph 1 O Line Graph 2 O Line Graph 3 0 O Line Graph 4 (b) Describe the trend (if any) and discuss possible causes. Trend is positive O. There seems to be an increase O in the rate of growth over the past few years. (c) Fit three trend models: linear, exponential, and quadratic. Which model would offer the most believable forecasts? (You may select more than one answer. Click the box with a check mark for the correct answer and double click to empty the box for the wrong answer.) (b) Describe the trend (if any) and discuss possible causes. Trend is positive O. There seems to be an increase O in the rate of growth over the past few years. (c) Fit three trend models: linear, exponential, and quadratic. Which model would offer the most believable forecasts? (You may select more than one answer. Click the box with a check mark for the correct answer and double click to empty the box for the wrong answer.) V Linear ? Quadratic Exponential (d) Make forecasts using the following fitted trend models for years 2017-2019. (Round your answers to the nearest whole number.) Linear Quadratic Exponential 20072.198018 11 198703.54 O 201396.99 199356.175871 12 199287.68 |203450.48 13 199871.82 205748.87
Expert Answer:

Related Book For 

The Essentials of Statistics A Tool for Social Research
ISBN: 978-1111829568
3rd edition
Authors: Joseph F. Healey
Posted Date:
Students also viewed these economics questions
-
(a) Make a line graph of the U.S. civilian labor force data. Line Graph 1 Line Graph 2 Line Graph 3 (b) Describe the trend (if any) and discuss possible causes. (c) Fit three trend models: linear,...
-
Use the Excel data file called Cars that you will find on Blackboard to complete this assignment Describe the distribution of each of the following variables in the file mpg engine year and cylinder...
-
Use the standard error to construct a prediction interval for Yusing an alpha of 5%. (Round your answer to 2 decimal places.) Prediction interval for Y: ;
-
?Claim: A of adults would erase all of their personalinformation online if they could. A software firm survey of 511randomly selected adults showed that 36 ?% of them would erase allof their pe...
-
Use a binomial lattice with the following attributes to value a European call option. Current underlying asset value of 60 Exercise price of 60 Volatility of 30% Risk-free rate of 5% Time to...
-
From among the molecules and ions shown, all of which are based on cycloundecapentaene, identify those which satisfy the criteria for aromaticity as prescribed by Huckel's rule. (a)...
-
The general solution to Stokes flow in 2D Cartesian coordinates. For the 2D case the governing equation is \(abla^{4} \psi=0\). The operator \(abla\) may be applied either in Cartesian \((x, y)\) or...
-
Reviewing the marketing department team concluded that a segment of Ashland households might be interested in a discounted trial subscription to the AMS 3- For- All cable/ phone/ Internet service. 1....
-
why do you think the Virginia Company continued to send colonists to Jamestown after the rise in mortality rate, the continued conflict with local tribes, and disease?
-
The proposed rates were not in the range the CEO expected given the pricing analysis. The CEO has asked the pricing actuary to verify the total projected loss cost excluding potential large storm...
-
Design a feed forward multi-layer neural network to approximate the function y=sin(x1)+cos(x2). Here, -5
-
Mrs. Johnson founded a chemical manufacturing company 25 years ago and built a successful business, which is now in a mature growth stage. She owns 100% of the company and is thinking about retiring...
-
Define the bottleneck effect. What category of evolutionary mechanism does the bottleneck effect belong to ? Give me an example of the bottleneck effect,
-
For the following project, the IRR and the Rate that maximizes the NPV are: Project A 0 -500 100 -8 1 28 100 38 100 48 100 100 58 6 7 8 9 100 100 100 100 10 -150
-
Valuing a company using FCFF instead of FCFE is likely more accurate if reliable market value estimates of its debt and equity securities are available. Why or why not ? Explain
-
Given below are the consolidated statements of financial position and the consolidated statement of profit or loss of Rainbow Bhd and its subsidiary Prism Bhd. Consolidated Statements of Financial...
-
The electric car market is rapidly evolving, with new models and features being introduced every year. As an engineer, explain how the concept of product life cycle applies to the electric car...
-
Which of the ocean zones shown would be home to each of the following organisms: lobster, coral, mussel, porpoise, and dragonfish? For those organisms you identify as living in the pelagic...
-
At St. Algebra College, the sociology and psychology departments have been feuding for years about the respective quality of their programs. In an attempt to resolve the dispute, you have gathered...
-
As part of an evaluation of the efficiency of your local police force, you have gathered the following data on police response time to calls for assistance during two different years. (Response times...
-
In problem 3.8, you computed mean and median income for 13 Canadian provinces and territories in two separate years. Now compute the standard deviation and range for each year, and taking account of...
-
On rare occasions, an organism may have three copies of a chromosome and therefore three copies of the genes on that chromosome (instead of the usual number of two copies). The alleles for each gene...
-
Outline the steps that occur when piRITS or piRISC silences transposable elements by repressing transcription and by directly inhibiting TE RNAs, respectively. What is the role of piRNAs in this...
-
Explain how the miR-200 family of miRNAs behave as tumorsuppressor genes. What happens when their expression is blocked or decreased?

Study smarter with the SolutionInn App