

Question: (a) Make a line graph of the U.S. civilian labor force data. Line Graph 1 Line Graph 2 Line Graph 3 (b) Describe the trend
(a) Make a line graph of the U.S. civilian labor force data.
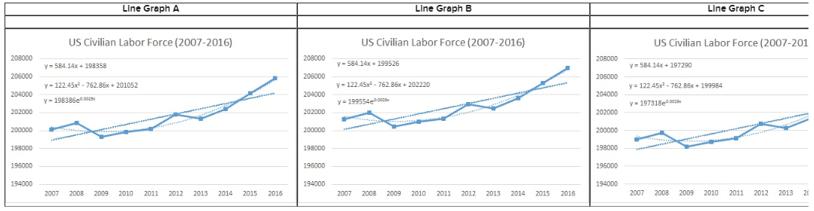
Line Graph 1
Line Graph 2
Line Graph 3
(b) Describe the trend (if any) and discuss possible causes.
(c) Fit three trend models: linear, exponential, and quadratic. Which model would offer the most believable forecasts? (You may select more than one answer. Click the box with a check mark for the correct answer and double click to empty the box for the wrong answer.)
? Linear
? Quadratic
? Exponential
(d) Make forecasts using the following fitted trend models for years 2017-2019. (Round your answers to the nearest whole number.)
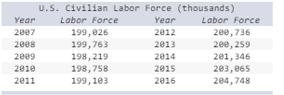
U.S. Civilian Labor Force (thousands) Year Labor Force Year Labor Force 2007 199,026 199, 763 198, 219 198,758 199,103 2012 200,736 20e, 259 201, 346 2008 2013 2009 2014 203, 065 204,748 2010 2015 2011 2016
Step by Step Solution
3.40 Rating (144 Votes )
There are 3 Steps involved in it
aLine plot is plotted using excel line plot b The trend is positive There seem... View full answer

Get step-by-step solutions from verified subject matter experts