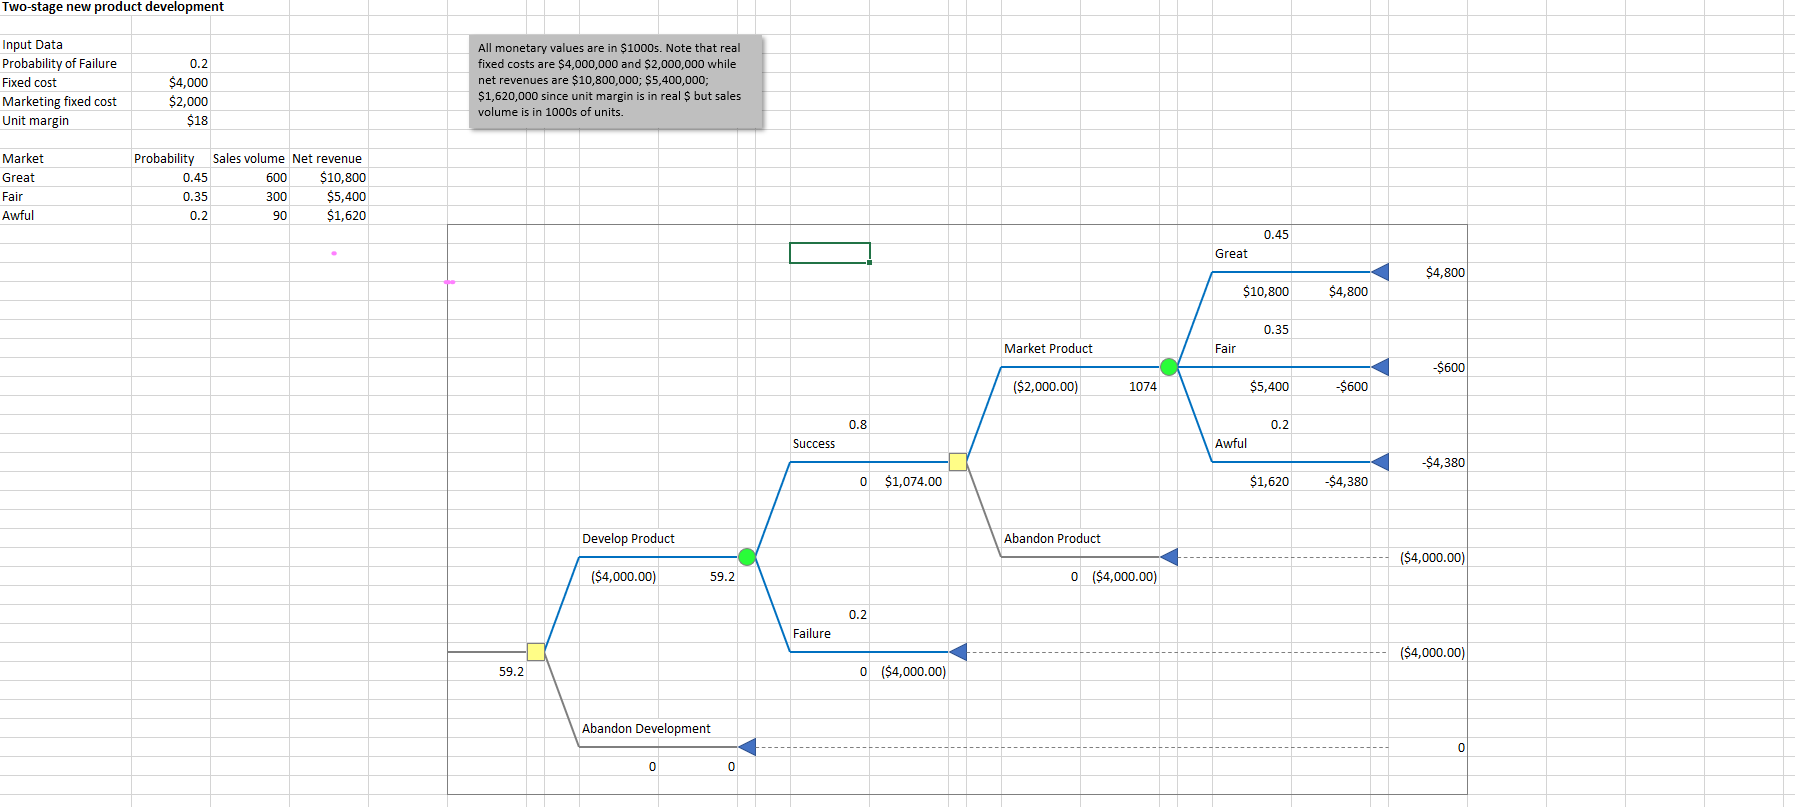
Question: Use a Data Table to show the solution's sensitivity to the probability of failure. Use values between 0-100% with increments of 10% and display both

Use a Data Table to show the solution's sensitivity to the probability of failure. Use values between 0-100% with increments of 10% and display both the Max EMV and the Best Decision, highlighting how the decision changes.

Use a Data Table to show the solution's

Two-stage new product development Input Data Probability of Failure Fixed cost Marketing fixed cost Unit margin 0.2 $4,000 $2,000 $18 All monetary values are in $1000s. Note that real fixed costs are $4,000,000 and $2,000,000 while net revenues are $10,800,000; $5,400,000; $1,620,000 since unit margin is in real $ but sales volume is in 1000s of units. Market Great Fair Awful Probability Sales volume Net revenue 0.45 600 $10,800 0.35 300 $5,400 0.2 90 $1,620 0.45 Great $4,800 $10,800 $4,800 0.35 Market Product Fair $600 ($2,000.00) 1074 $5,400 $600 0.8 0.2 Success Awful $4,380 0 $1,074.00 $1,620 $4,380 Develop Product Abandon Product ($4,000.00) ($4,000.00) 59.2 0 ($4,000.00) 0.2 Failure ($4,000.00) 59.2 0 $4,000.00) Abandon Development 0 0 0

Step by Step Solution

There are 3 Steps involved in it

1 Expert Approved Answer
Step: 1 Unlock blur-text-image
Question Has Been Solved by an Expert!

Get step-by-step solutions from verified subject matter experts

Step: 2 Unlock
Step: 3 Unlock

Students Have Also Explored These Related General Management Questions!