

Question: Use a graphing calculator to graph the normal probability density function f(x)=- =400 and the standard deviation = 200 1 Choose the correct graph
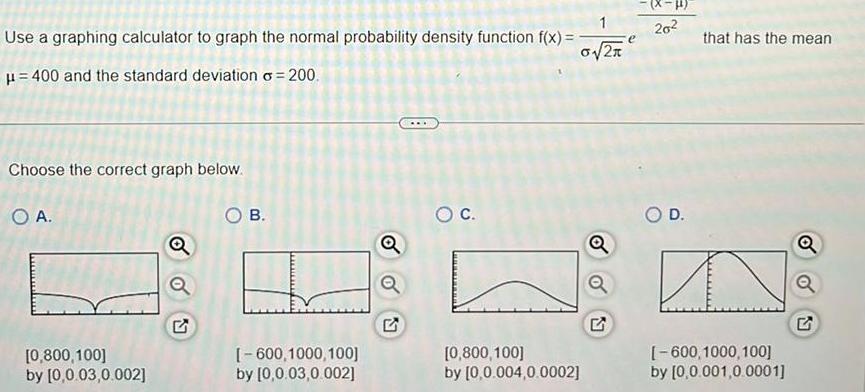
Use a graphing calculator to graph the normal probability density function f(x)=- =400 and the standard deviation = 200 1 Choose the correct graph below. O A. [0,800,100] by [0,0.03,0.002] e (x-1) 202 B. O C. D. a Q G [-600,1000,100] by [0,0.03,0.002] G [0,800,100] by [0,0.004,0.0002] G that has the mean [-600,1000,100] by [0,0.001,0.0001] G
Step by Step Solution
There are 3 Steps involved in it
1 Expert Approved Answer
Step: 1 Unlock

Question Has Been Solved by an Expert!
Get step-by-step solutions from verified subject matter experts
Step: 2 Unlock
Step: 3 Unlock