

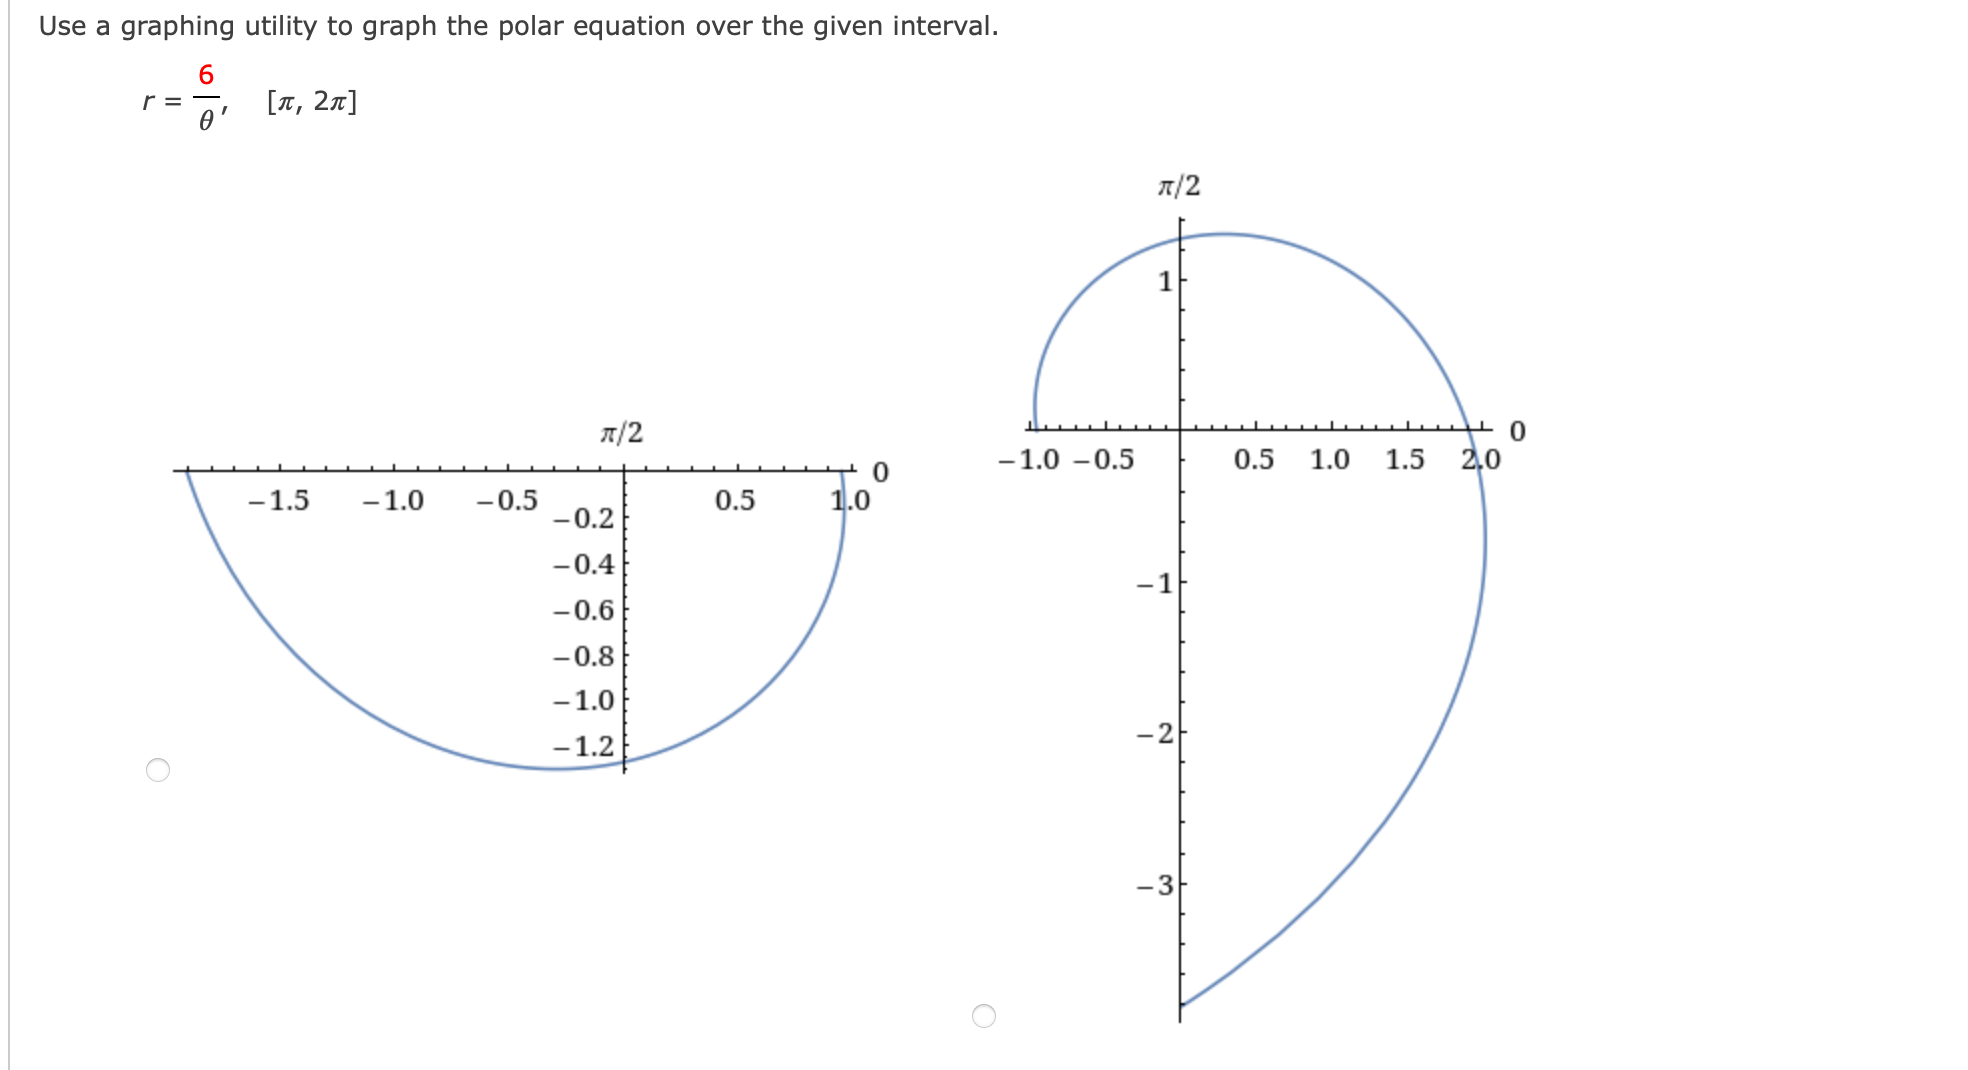
Question: Use a graphing utility to graph the polar equation over the given interval. r = E, [In 27:] O 3 7/2 1.2 2 1.0 0.8
![given interval. r = E, [In 27:] O 3 7/2 1.2 2](https://s3.amazonaws.com/si.experts.images/answers/2024/06/66669e8e4e375_29466669e8e279de.jpg)

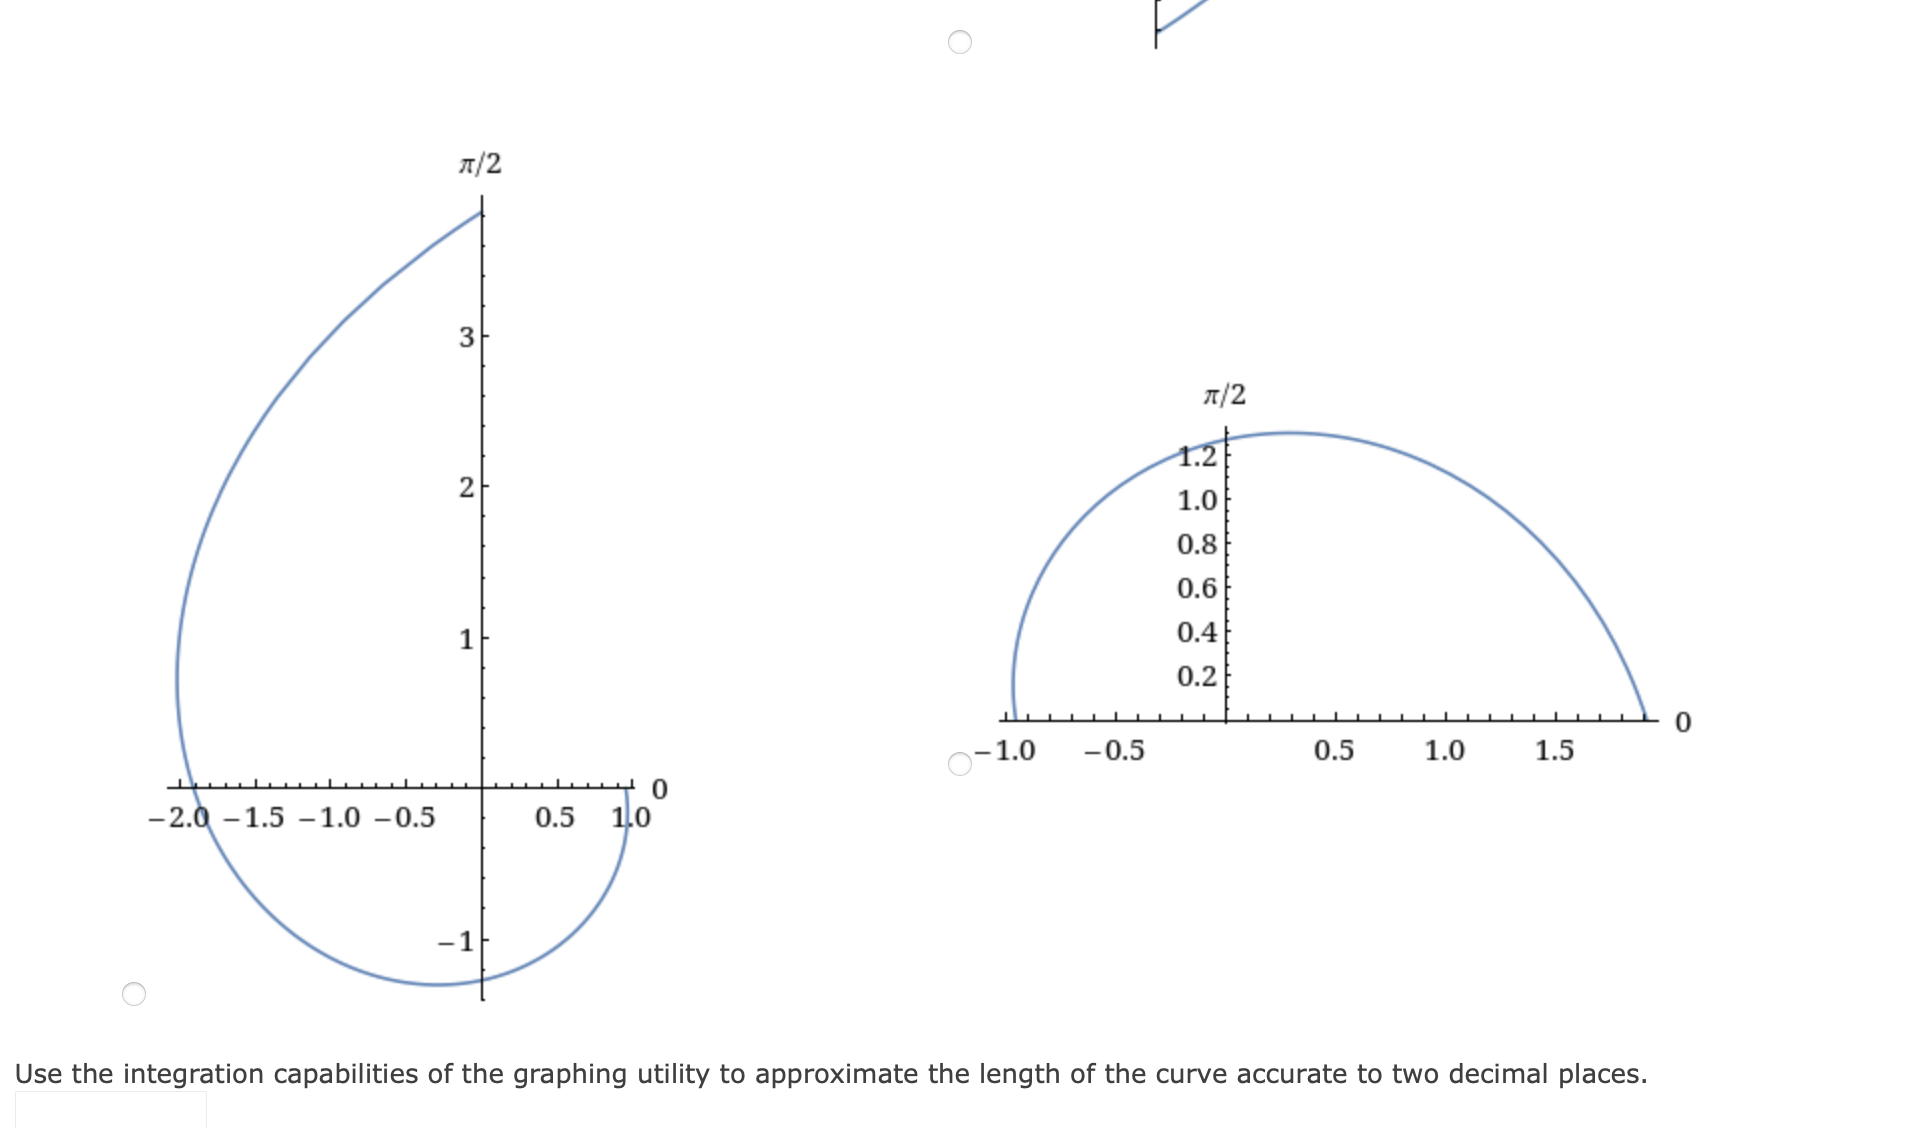
Use a graphing utility to graph the polar equation over the given interval. r = E, [In 27:] O 3 7/2 1.2 2 1.0 0.8 0.6 1 0.4 0.2 0 -1.0 -0.5 0.5 1.0 1.5 0 -2.0 -1.5 -1.0 -0.5 0.5 1.0 Use the integration capabilities of the graphing utility to approximate the length of the curve accurate to two decimal places
Step by Step Solution
There are 3 Steps involved in it
1 Expert Approved Answer
Step: 1 Unlock

Question Has Been Solved by an Expert!
Get step-by-step solutions from verified subject matter experts
Step: 2 Unlock
Step: 3 Unlock