

Question: Use a Monte Carlo simulation to answer the following question: Penn Technologies Corp. is considering an investment in a new production facility to manufacture carbon
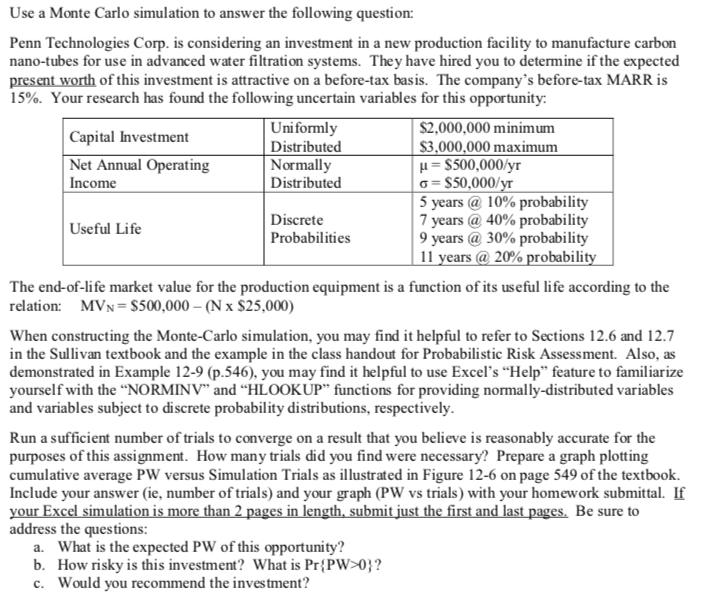
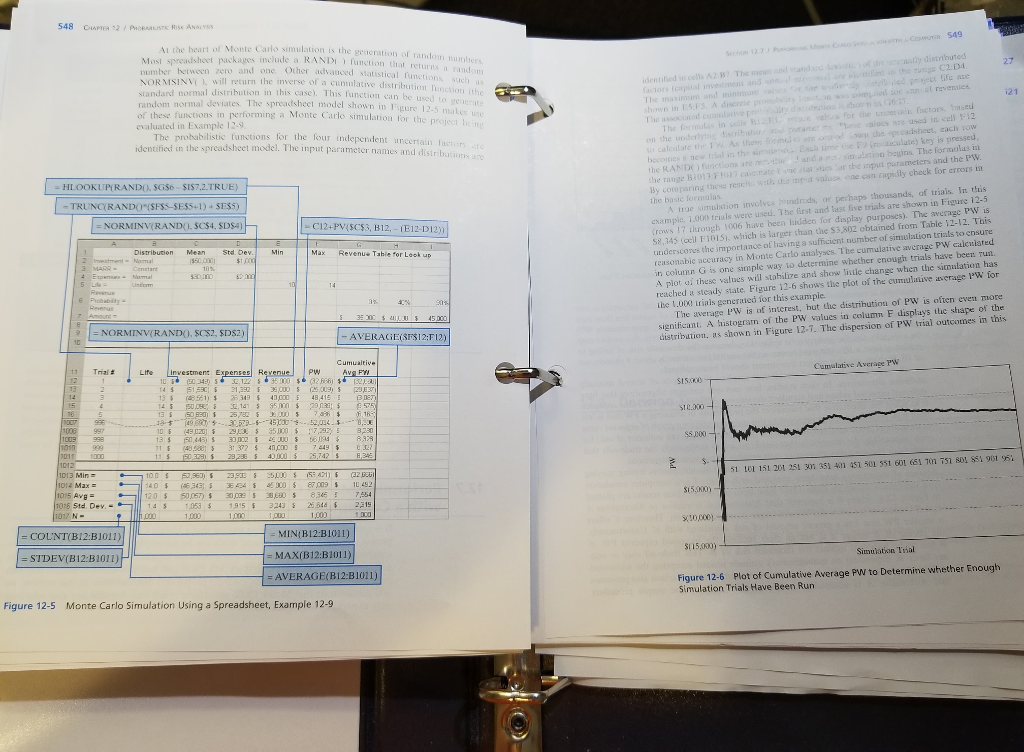
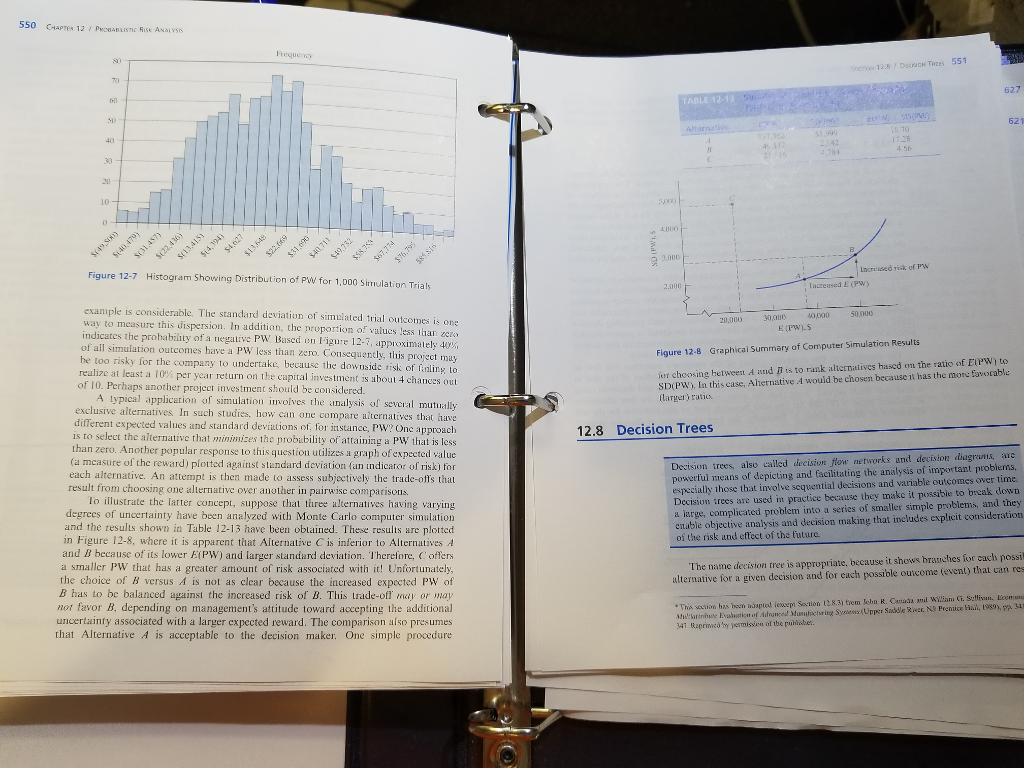
Use a Monte Carlo simulation to answer the following question: Penn Technologies Corp. is considering an investment in a new production facility to manufacture carbon nano-tubes for use in advanced water filtration systems. They have hired you to determine if the expected present worth of this investment is attractive on a before-tax basis. The company's before-tax MARR is 15%. Your research has found the following uncertain variables for this opportunity: Uniformly Distributed Normall Distributed 2,000,000 minimum S3.000,000 maximum Capital Investment Net Annual Operating Income S500,000/yr -$50.000/ 5 years @ 10% probability 7 years @ 40% probability 9 years @ 30% probability 11 years @ 20% probabilit Discrete Probabilities Useful Life The end-of-life market value for the production equipment is a function of its useful life according to the relation MVN-S500,000 (N x $25,000) When constructing the Monte-Carlo simulation, you may find it helpful to refer to Sections 12.6 and 12.7 in the Sullivan textbook and the example in the class handout for Probabilistic Risk Assessment. Also, as demonstrated in Example 12-9 (p.546), you may find it helpful to use Excel's "Help" feature to familiarize yourself with the "NORMINV" and "HLOOKUP" functions for providing normally-distributed variables and variables subject to discrete probability distributions, respectively Run a sufficient number of trials to converge on a result that you believe is reasonably accurate for the purposes of this assignment. How many trials did you find were necessary? Prepare a graph plotting cumulative average PW versus Simulation Trials as illustrated in Figure 12-6 on page 549 of the textbook. Include your answer (ie, number of trials) and your graph (PW vs trials) with your homework submittal. If Be sure to address the questions: a. What is the expected PW of this opportunity? b. How risky is this investment? What is PrP 0? c. Would you recommend the investment? Use a Monte Carlo simulation to answer the following question: Penn Technologies Corp. is considering an investment in a new production facility to manufacture carbon nano-tubes for use in advanced water filtration systems. They have hired you to determine if the expected present worth of this investment is attractive on a before-tax basis. The company's before-tax MARR is 15%. Your research has found the following uncertain variables for this opportunity: Uniformly Distributed Normall Distributed 2,000,000 minimum S3.000,000 maximum Capital Investment Net Annual Operating Income S500,000/yr -$50.000/ 5 years @ 10% probability 7 years @ 40% probability 9 years @ 30% probability 11 years @ 20% probabilit Discrete Probabilities Useful Life The end-of-life market value for the production equipment is a function of its useful life according to the relation MVN-S500,000 (N x $25,000) When constructing the Monte-Carlo simulation, you may find it helpful to refer to Sections 12.6 and 12.7 in the Sullivan textbook and the example in the class handout for Probabilistic Risk Assessment. Also, as demonstrated in Example 12-9 (p.546), you may find it helpful to use Excel's "Help" feature to familiarize yourself with the "NORMINV" and "HLOOKUP" functions for providing normally-distributed variables and variables subject to discrete probability distributions, respectively Run a sufficient number of trials to converge on a result that you believe is reasonably accurate for the purposes of this assignment. How many trials did you find were necessary? Prepare a graph plotting cumulative average PW versus Simulation Trials as illustrated in Figure 12-6 on page 549 of the textbook. Include your answer (ie, number of trials) and your graph (PW vs trials) with your homework submittal. If Be sure to address the questions: a. What is the expected PW of this opportunity? b. How risky is this investment? What is PrP 0? c. Would you recommend the investment
Step by Step Solution
There are 3 Steps involved in it

Get step-by-step solutions from verified subject matter experts