

Question: Use a stemandIeaf plot to display the data, which represent the scores of a biology class on a midterm exam. Describe any patterns. 75 85
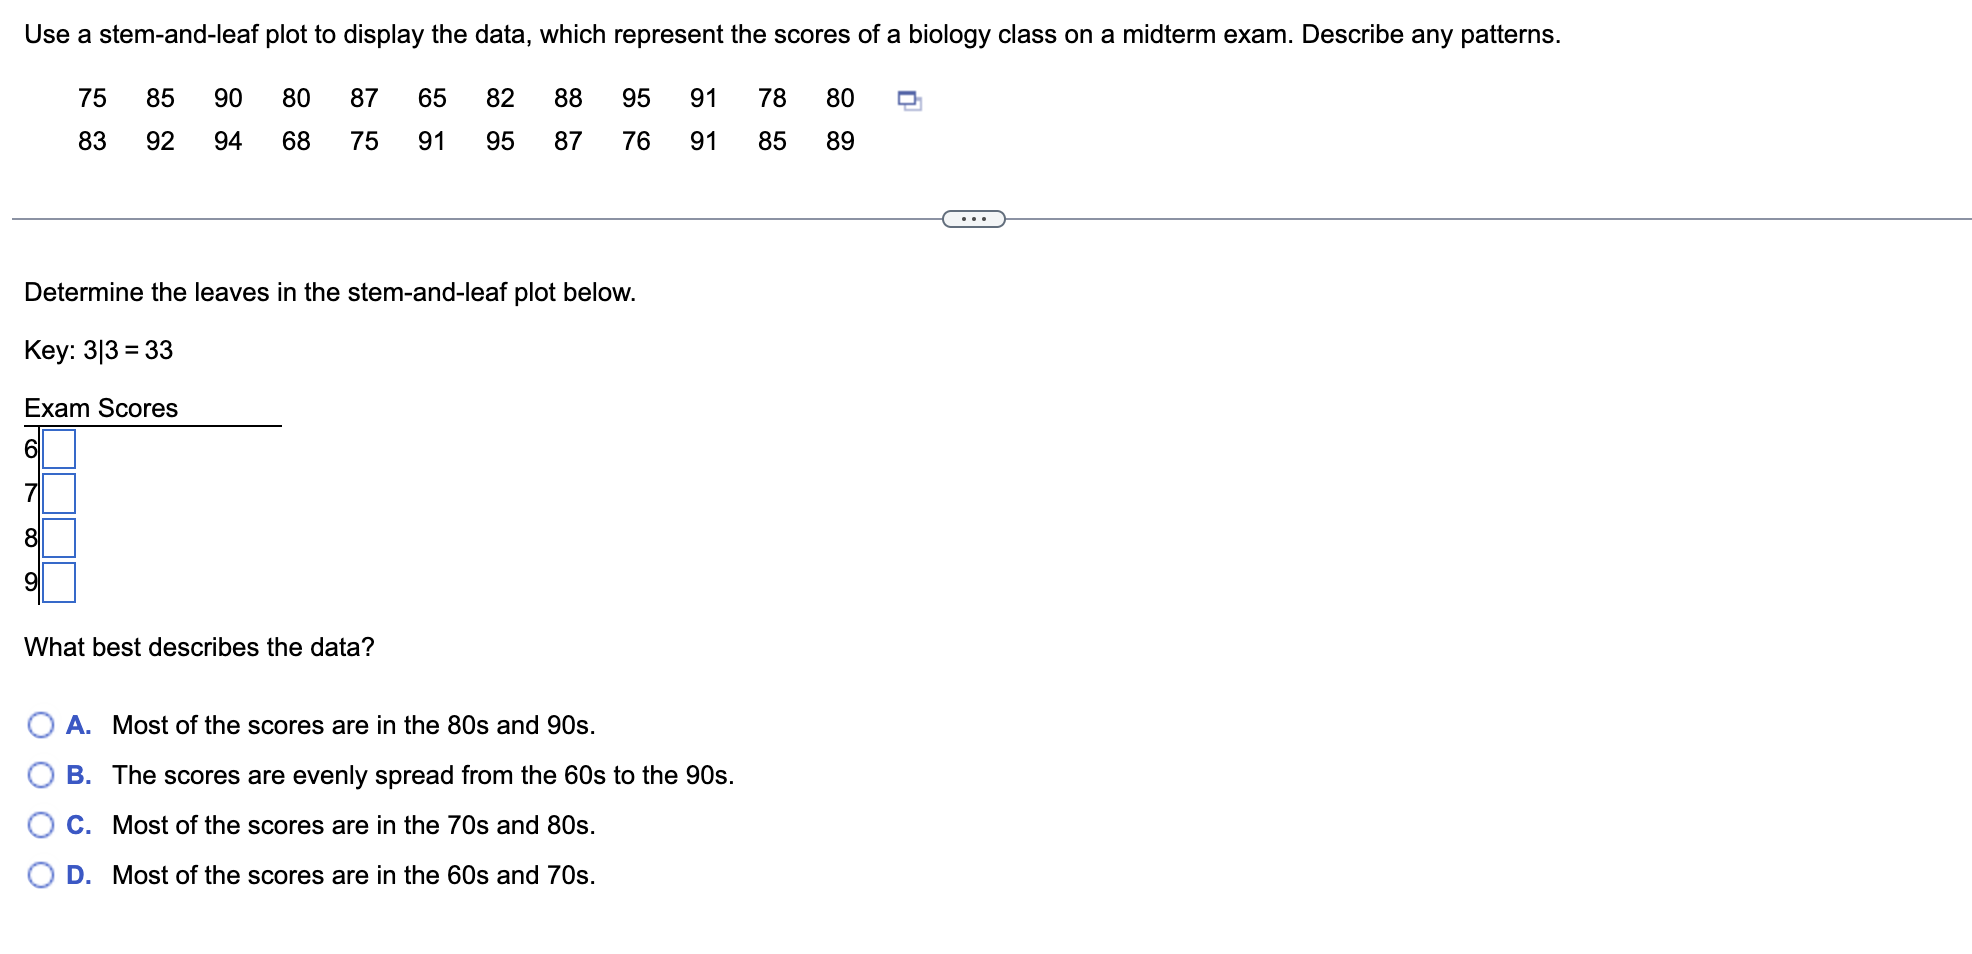
Use a stemandIeaf plot to display the data, which represent the scores of a biology class on a midterm exam. Describe any patterns. 75 85 90 80 87 65 82 88 95 9178 80 CI 83 92 94 68 75 91 95 87 76 91 85 89 Determine the leaves in the stemandleaf plot below. Key: 3|3 = 33 Exam Scores What best describes the data? {:2} A. Most of the scores are in the 805 and 903. Cir B. The scores are evenly spread from the 605 to the 905. C. Most of the scores are in the 705 and 805. {:2} D. Most of the scores are in the 605 and 705
Step by Step Solution
There are 3 Steps involved in it
1 Expert Approved Answer
Step: 1 Unlock

Question Has Been Solved by an Expert!
Get step-by-step solutions from verified subject matter experts
Step: 2 Unlock
Step: 3 Unlock