

Question: Use a stem-and-leaf plot to display the data, which represent the scores of a biology class on a midterm exam Describe any patterns 75 85
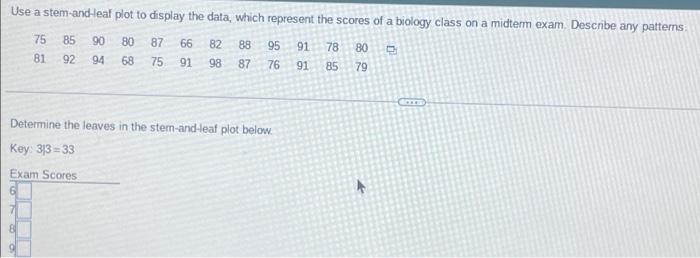
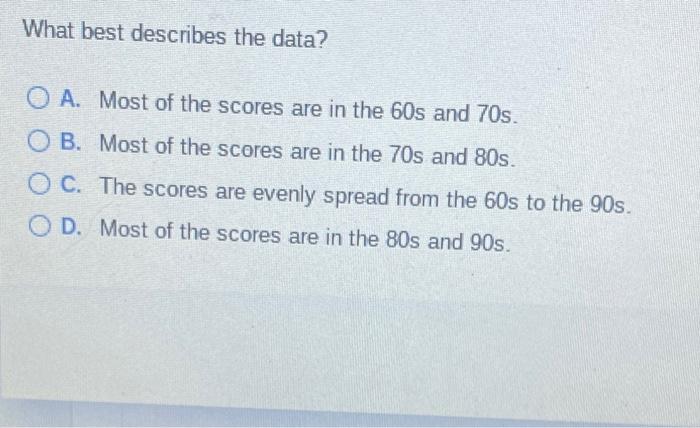
Use a stem-and-leaf plot to display the data, which represent the scores of a biology class on a midterm exam Describe any patterns 75 85 90 80 87 66 82 88 95 91 78 80 81 92 94 68 75 91 98 87 76 91 85 79 Determine the leaves in the stem-and-leaf plot below. Key: 313 = 33 Exam Scores What best describes the data? O A. Most of the scores are in the 60s and 70s. O B. Most of the scores are in the 70s and 80s. O C. The scores are evenly spread from the 60s to the 90s. D. Most of the scores are in the 80s and 90s
Step by Step Solution
There are 3 Steps involved in it
1 Expert Approved Answer
Step: 1 Unlock

Question Has Been Solved by an Expert!
Get step-by-step solutions from verified subject matter experts
Step: 2 Unlock
Step: 3 Unlock