

Question: Use a stem-and-leaf plot to display the data, which represent the thickness (in centimeters) of ice measured at 20 different loca 5.8 6.5 6.9 7.2
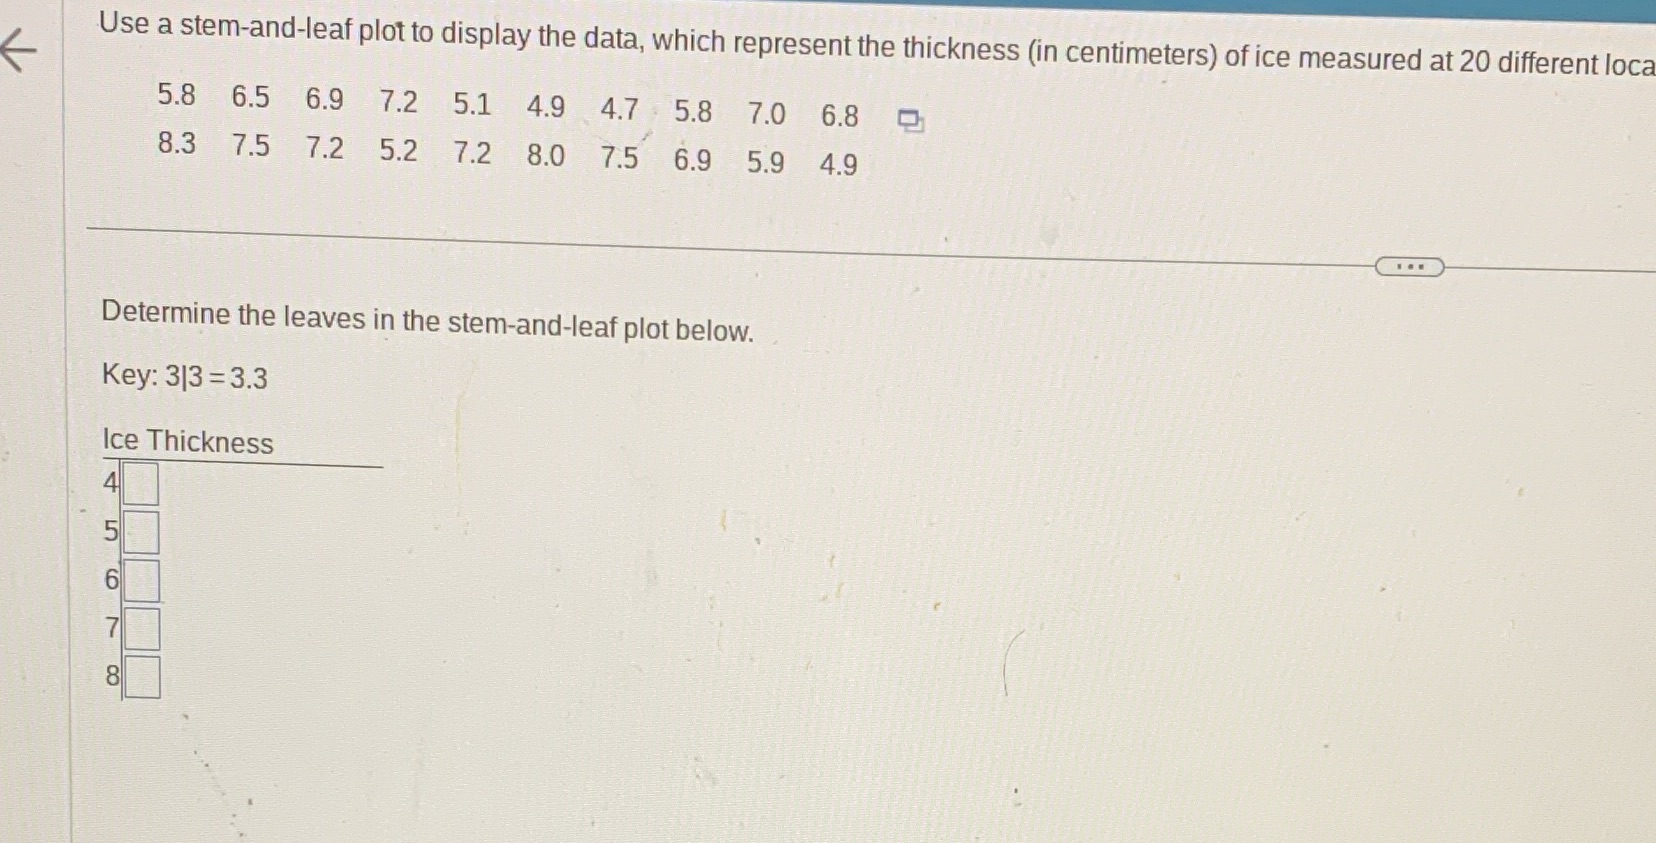

Use a stem-and-leaf plot to display the data, which represent the thickness (in centimeters) of ice measured at 20 different loca 5.8 6.5 6.9 7.2 5.1 4.9 4.7 5.8 7.0 6.8 8.3 7.5 7.2 5.2 7.2 8.0 7.5 6.9 5.9 4.9 Determine the leaves in the stem-and-leaf plot below. Key: 313 = 3.3 Ice Thickness
Step by Step Solution
There are 3 Steps involved in it
1 Expert Approved Answer
Step: 1 Unlock

Question Has Been Solved by an Expert!
Get step-by-step solutions from verified subject matter experts
Step: 2 Unlock
Step: 3 Unlock