

Question: Use a stem-and-leaf plot to display the data, which represent the thickness (in centimeters) of ice measured at 20 different locations on a frozen lake.
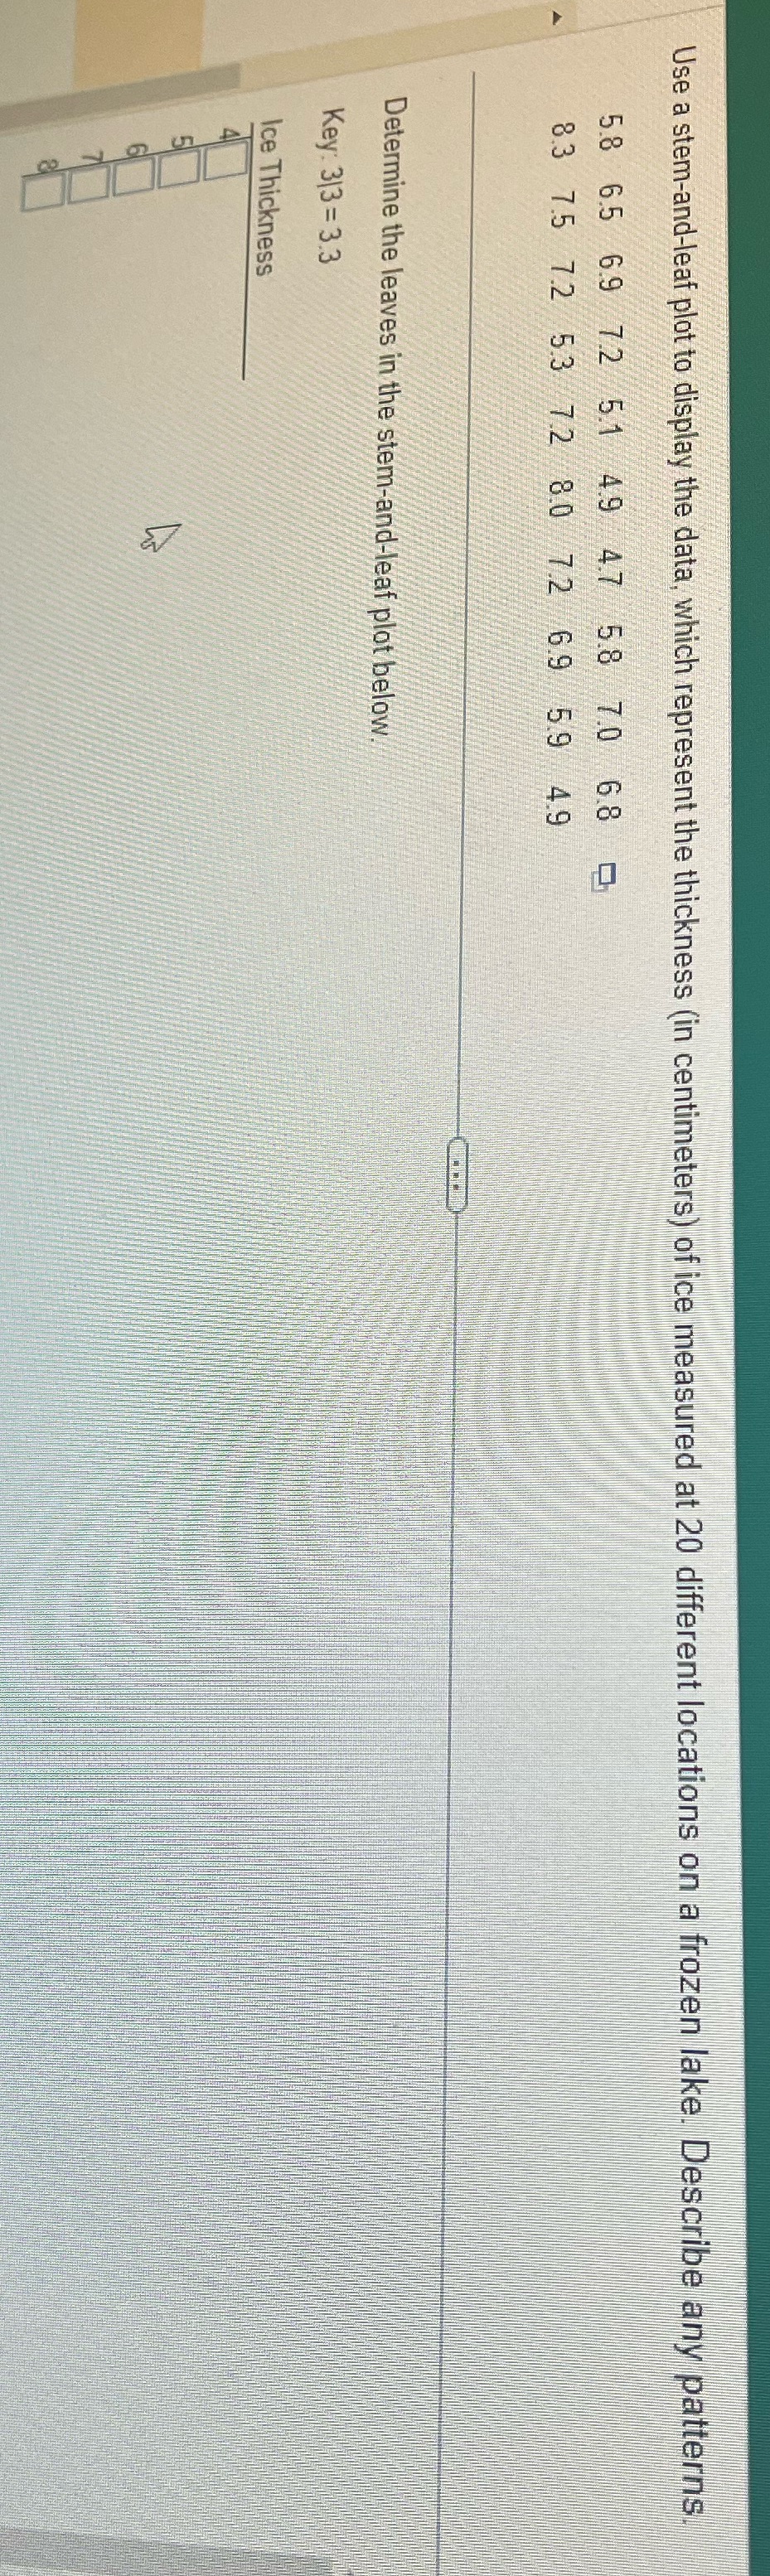
Use a stem-and-leaf plot to display the data, which represent the thickness (in centimeters) of ice measured at 20 different locations on a frozen lake. Describe any patterns 58 65 69 72 51 49 47 58 70 68 3 83 75 72 53 72 80 72 69 59 49 Determine the leaves in the stem-and-leaf plot below. Key: 313 = 3.3 Ice Thickness
Step by Step Solution
There are 3 Steps involved in it
1 Expert Approved Answer
Step: 1 Unlock

Question Has Been Solved by an Expert!
Get step-by-step solutions from verified subject matter experts
Step: 2 Unlock
Step: 3 Unlock