

Question: Use an alpha of 0.05 1. E 243 Data for Regression Demonstration gives the heights of students, parents, and grand-parents. In class, we will answer
Use an alpha of 0.05
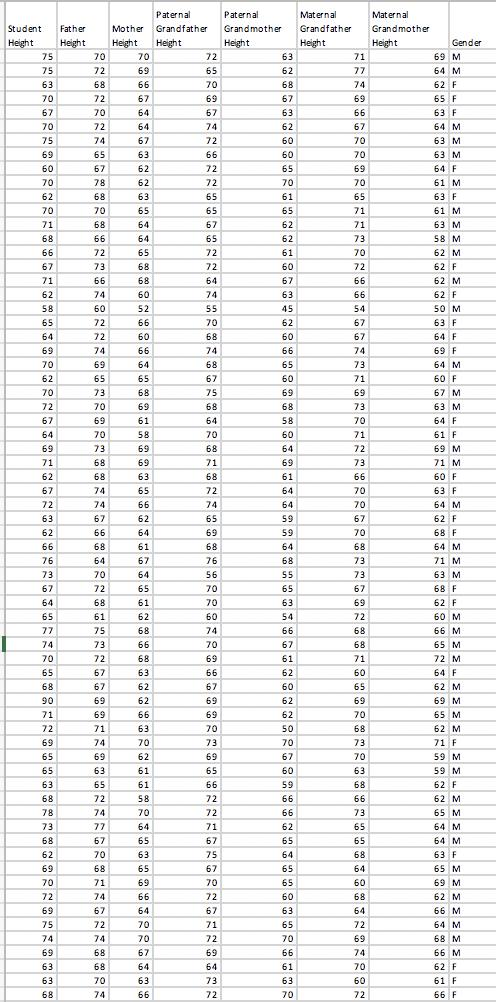
1. E 243 Data for Regression Demonstration gives the heights of students, parents, and
grand-parents. In class, we will answer the questions for male heights. For homework,
you will answer the same questions for female heights.
a) Report the summary statistics for student heights.
b) Are there any outliers in heights data?
c) Present a histogram of heights.
d) Of all the parents and grandparents, whose height correlates best with the student height?
e) Present a scatterplot of father's heights vs student heights.
f) What is the correlation coefficient of the father's height vs student height?
g) Fit a regression model with student height as the dependent variable and father's height
as the explanatory variable.
h) Does the sign of the slope parameter surprise you? What does your model predict as the
change in height for an additional inch of height in the father's height?
i) What student height would you predict for a student whose father's height is 70 inches?
j) What does the model tell about a student's height whose father is 55 inches tall?
k) What is the estimate of the error variance?
l) What is the standard error for the slope parameter?
m) Construct and interpret a 1-sided 95% confidence interval for the slope parameter that
provides an upper bound.
n) Test the alternate hypothesis that the slope parameter is not equal to zero. Is it clear that
on average student height increases with father's height?
o) Compute the ANOVA table and calculate R2
. Explain the interpretation of the coefficient of determination.
p) What is the sample correlation coefficient "r"? Show that the t-statistic calculated in
terms of t = r(n-2)0.5/(1-r2)0.5 is equal to the ratio of the slope estimate with standard error.
2. Fit a multiple linear regression model with all variables to predict student heights. Apply
Backward Elimination process and state what model you would finally report? Also
report the R2 and F-stat values for both the models.
Student
Paternal Paternal Maternal Student Father Grandfather Grandmother Grandfather Grandmother Height Height Height Height Height Height Gender 70 70 72 63 71 69 M 72 65 62 77 68 66 70 68 74 62 F 69 65 F 67 70 67 63 56 63 F 70 72 74 64 M 72 63 M 69 65 66 60 70 72 69 64 F 72 61 M 62 68 65 61 65 63 F 65 71 61 M 68 62 71 63 M 68 66 65 62 73 58 M 72 61 70 72 72 62 F 66 64 67 66 62 M 74 63 66 62 F 58 5S 54 50 M 72 70 63 F 72 60 68 60 67 69 74 66 74 56 74 69 F 68 73 64 M 62 65 67 60 71 60 F 70 75 69 69 67 M 68 73 67 69 61 64 58 70 64 F 58 70 71 61 F 73 68 69 M 71 68 69 71 69 73 62 68 66 60 F 72 63 F 72 74 66 74 64 70 64 M 65 62 F 66 69 59 68 F 66 68 68 64 68 64 M 76 68 73 71 M 56 73 63 M 72 65 70 65 67 68 F 68 70 63 69 60 77 75 74 66 68 66 M 73 70 67 68 70 69 61 66 64 F 68 67 67 60 65 90 69 69 69 M 69 62 65 M 72 71 63 70 50 68 62 M 69 74 73 73 71 F 69 59 M 63 65 60 63 66 68 62 F 58 72 66 66 62 M 74 70 72 66 73 65 M 71 64 M 68 65 67 65 65 64 M 70 75 64 68 63 F 68 67 64 65 M 70 65 69 M 72 60 68 62 M 67 64 67 63 64 66 M 71 72 64 M 72 68 M 68 69 66 74 66 M 64 61 70 62 F 73 61 F 74 66 72 70 72 66 F
Step by Step Solution
There are 3 Steps involved in it

Get step-by-step solutions from verified subject matter experts