

Question: Use attached graph to answer question please. correct answers within an hour get upvote!! D H 1 SUMMARY OUTPUT 2 3 Regression Statistics 4 Multiple
Use attached graph to answer question please. correct answers within an hour get upvote!!
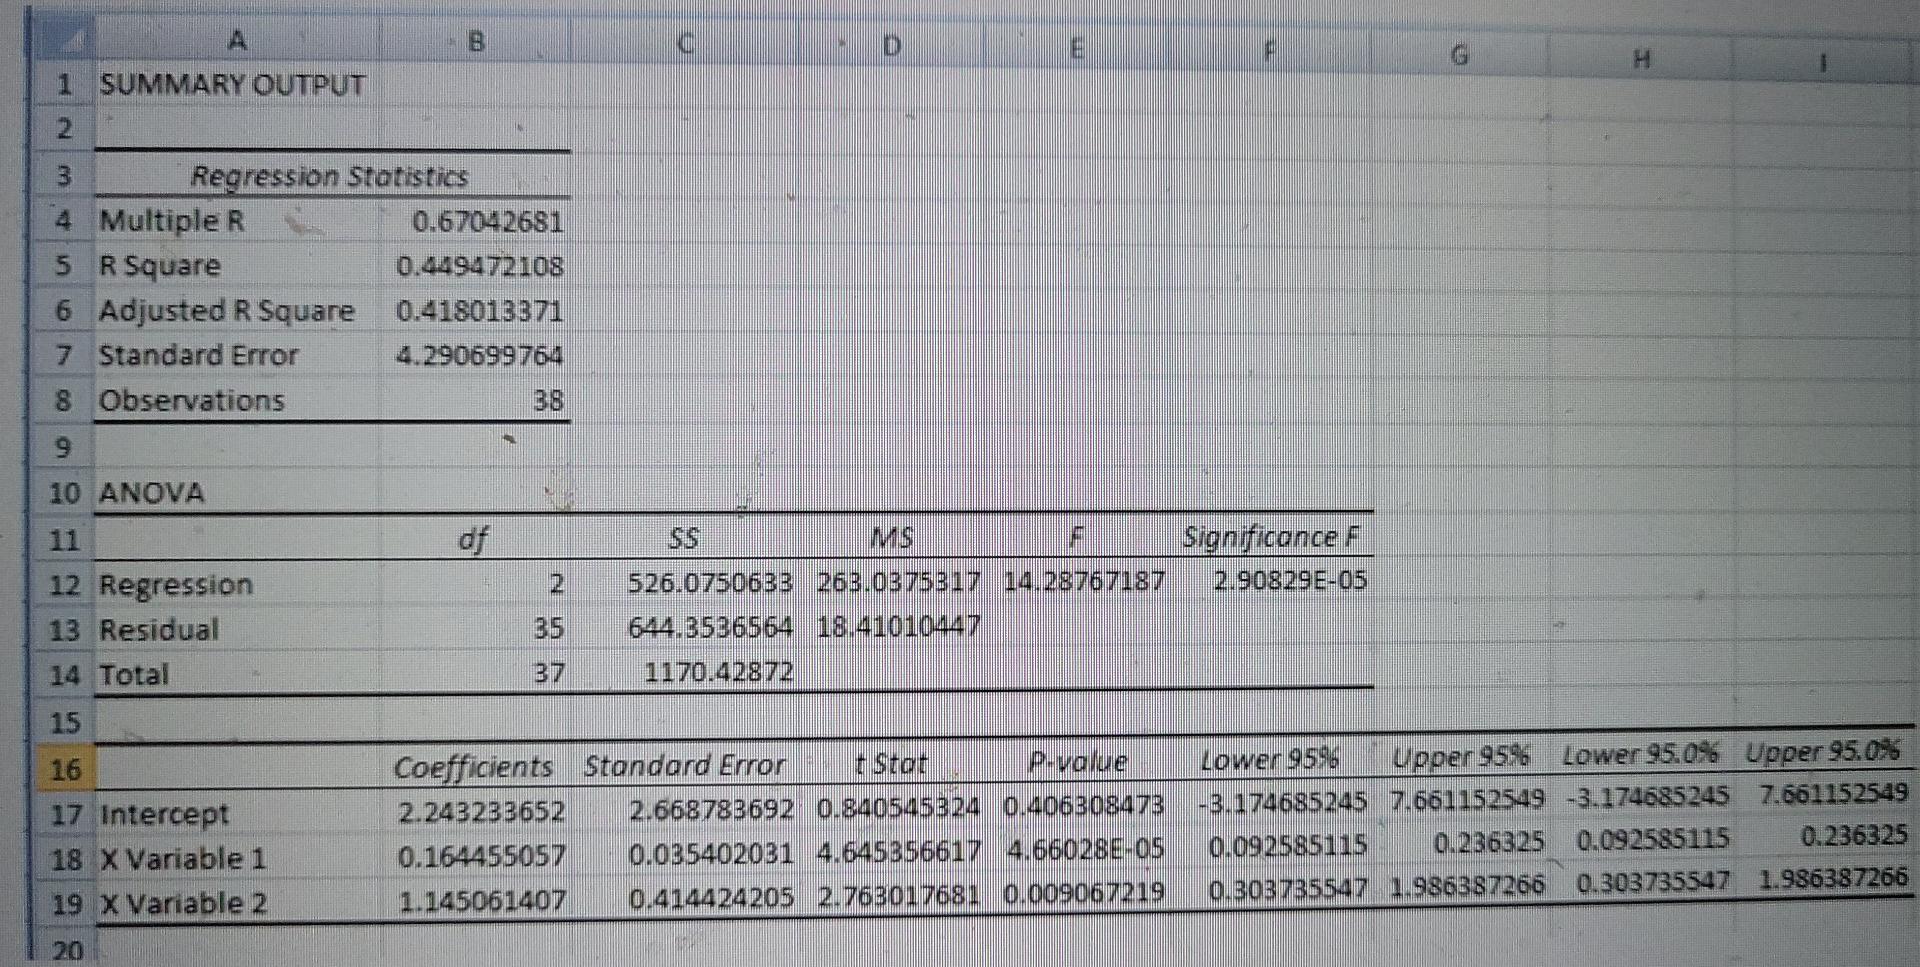
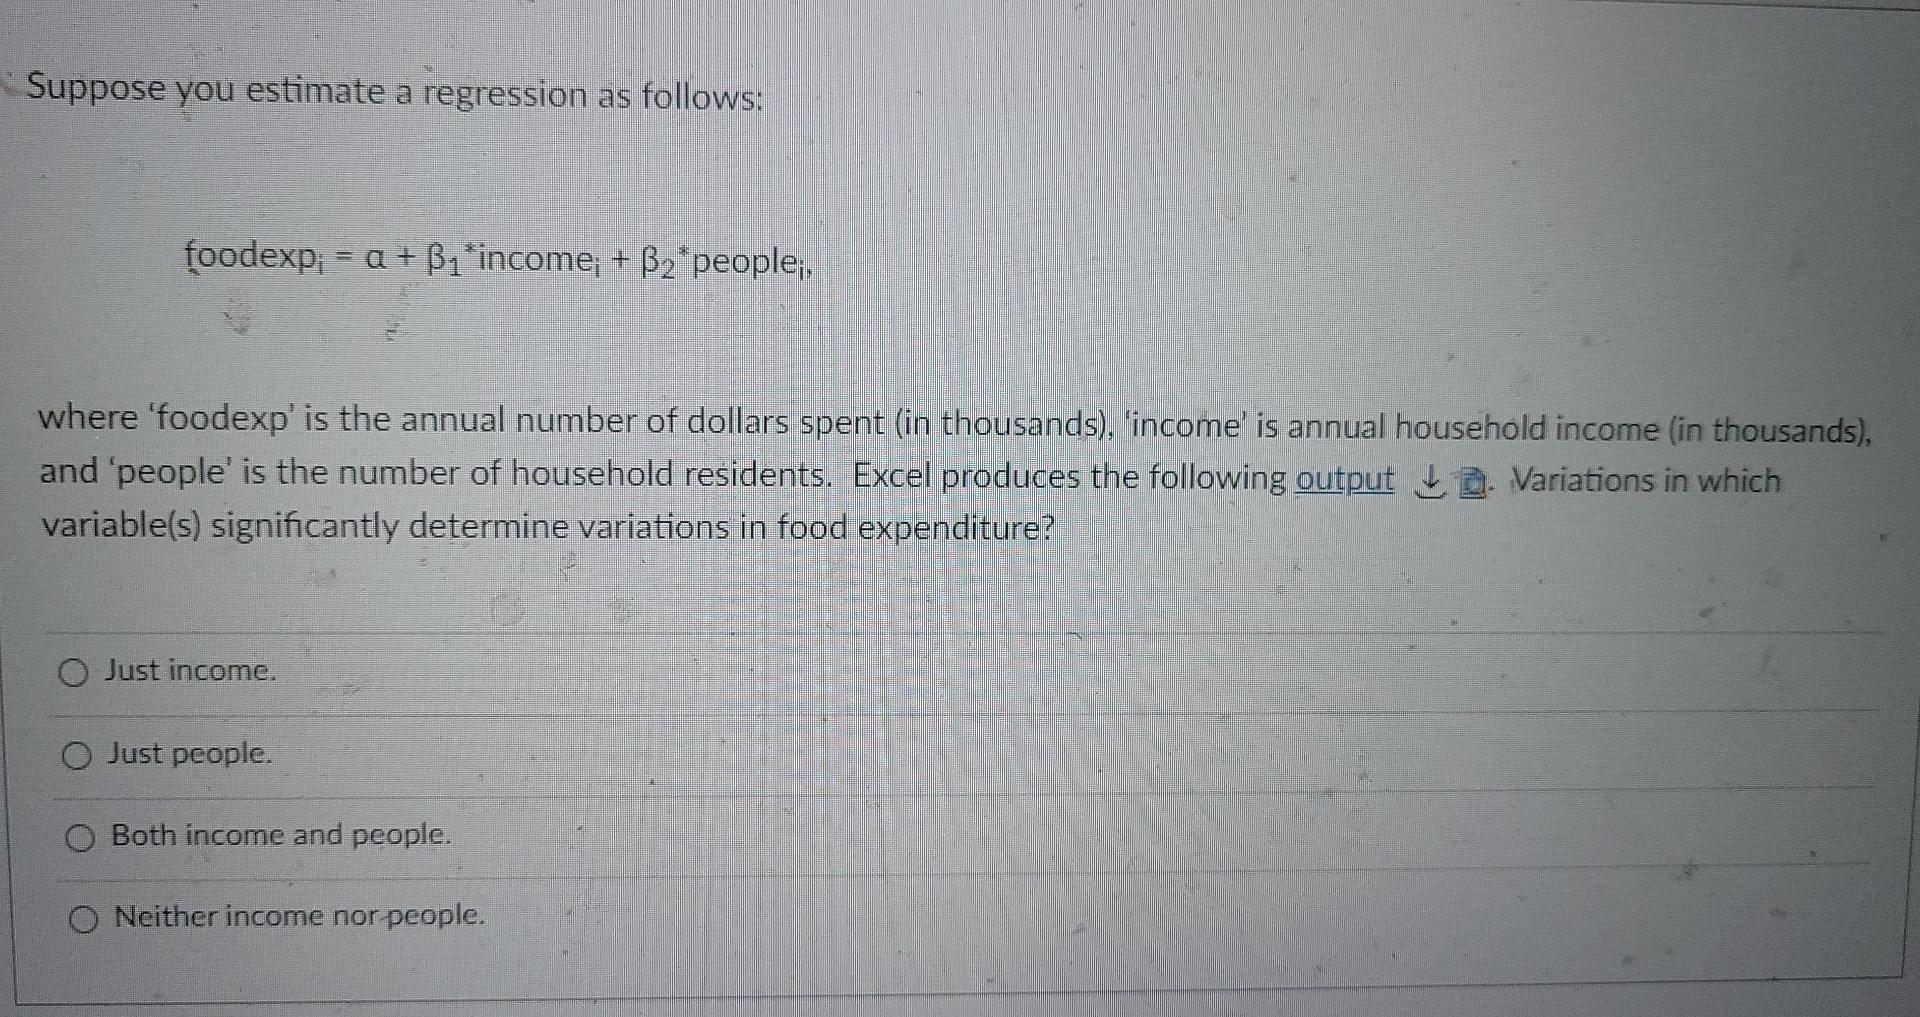
D H 1 SUMMARY OUTPUT 2 3 Regression Statistics 4 Multiple R 0.67042681 5 R Square 0.449472108 6 Adjusted R Square 0.418013371 7 Standard Error 4.290699764 8 Observations 9 10 ANOVA of 12 Regression 13 Residual 14 Total Significance F 526.0750633 263.0375317 14.28767187 2.90829E-05 644.3536564 18.41010447 1170.42872 35 37 16 17 Intercept 18 X Variable 1 19 X Variable 2 Coefficients Standard Error Stot P-value 2.243233652 2.668788692 0.840545324 0.406308473 0.164455057 0.035402031 4.645856617 4.660286-05 1.145061407 0.414424 205 2.763017681 0.009067219 Lower 9596 Upper 95% Lower 95.0% Upper 95.0% -3.174685245 7.661152549 -3.174685245 7.661152549 0.092585115 0.236325 0.092585115 0.236325 0.303735547 1.986387266 0.303735547 1.986387266 20 Suppose you estimate a regression as follows: foodexp; = a + B1'income; + B2 people;, where 'foodexp' is the annual number of dollars spent (in thousands), 'income' is annual household income (in thousands), and people' is the number of household residents. Excel produces the following output . Variations in which variable(s) significantly determine variations in food expenditure? O Just income. O Just people. Both income and people. O Neither income nor people
Step by Step Solution
There are 3 Steps involved in it

Get step-by-step solutions from verified subject matter experts