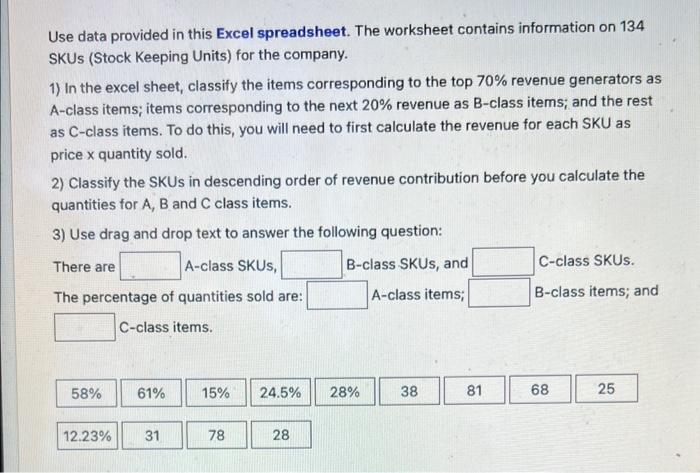
Question: Use data provided in this Excel spreadsheet. The worksheet contains information on 134 SKUs (Stock Keeping Units) for the company. 1) In the excel sheet,

Use data provided in this Excel spreadsheet. The
Use data provided in this Excel spreadsheet. The worksheet contains information on 134 SKUs (Stock Keeping Units) for the company. 1) In the excel sheet, classify the items corresponding to the top 70% revenue generators as A-class items; items corresponding to the next 20% revenue as B-class items; and the rest as C-class items. To do this, you will need to first calculate the revenue for each SKU as price x quantity sold. 2) Classify the SKUs in descending order of revenue contribution before you calculate the quantities for A,B and C class items. 3) Use drag and drop text to answer the following question: There are The percentage of quantities sold are: A-class items; C-class SKUs. C-class items. Use data provided in this Excel spreadsheet. The worksheet contains information on 134 SKUs (Stock Keeping Units) for the company. 1) In the excel sheet, classify the items corresponding to the top 70% revenue generators as A-class items; items corresponding to the next 20% revenue as B-class items; and the rest as C-class items. To do this, you will need to first calculate the revenue for each SKU as price x quantity sold. 2) Classify the SKUs in descending order of revenue contribution before you calculate the quantities for A,B and C class items. 3) Use drag and drop text to answer the following question: There are The percentage of quantities sold are: A-class items; C-class SKUs. C-class items

Step by Step Solution

There are 3 Steps involved in it

1 Expert Approved Answer
Step: 1 Unlock blur-text-image
Question Has Been Solved by an Expert!

Get step-by-step solutions from verified subject matter experts

Step: 2 Unlock
Step: 3 Unlock

Students Have Also Explored These Related General Management Questions!