

Question: USE DU POINT FORMULA This indicates how effectively the owners (shareholders) investment is being employed; the efficiency with which managers use the owners' equity investment
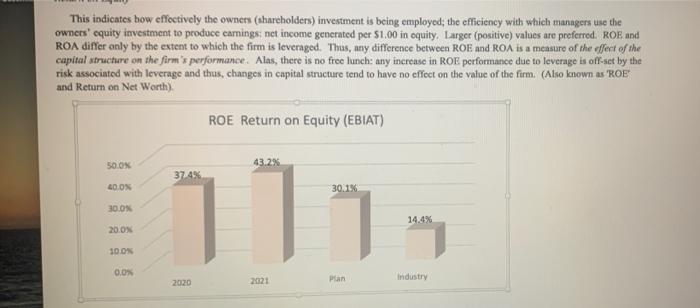
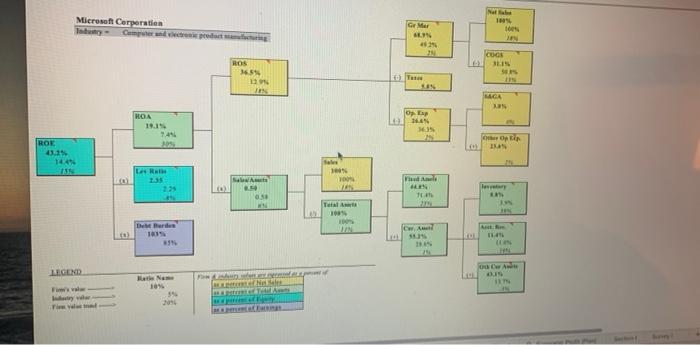
This indicates how effectively the owners (shareholders) investment is being employed; the efficiency with which managers use the owners' equity investment to produce carnings, net income generated per $1.00 in oquity, Larger (positive) values are preferred. ROE and ROA differ only by the extent to which the firm is leveraged. Thus, any difference between ROE and ROA is a measure of the effect of the capital structure on the firm's performance. Alas, there is no free lunch: any increase in ROE performance due to leverage is off-set by the risk associated with leverage and thus, changes in capital structure tend to have no effect on the value of the firm. (Also known as 'ROE and Return on Net Worth) ROE Return on Equity (EBIAT) 0.0 43.2% 37.4% 200 30.196 100 11 14.4% 20.0% 10.0% 00 Plan 2021 2020 Industry QU. KUE conclusion, overall: a. the firm is more efficient in carning a profit on each dollar of Equity than the industry average, and is improving. b. the firm is more efficient in caring a profit on cach dollar of Equity than the industry average, but is declining. c. the firm is less efficient in carning a profit on cach dollar of Equity than the industry average, but is improving. d. the fire is less efficient in earning a profit on each dollar of Equity than the industry average, and is declining. Q31. ROE conclusion, performance relative to industry: 2. Return on Equity is better than the industry average performance due primarily to the superior Return on Assets. b. Return on Equity is better thun the industry average performance due primarily to higher financial Leverage c. Return on Equity is worse than the industry average performance duc primarily to the inferior Return on Assets. d. Return on Equity is worse than the industry average performance duc primarily to lower financial Leverage, e. Return on Equity is equal to the industry average. Q32. ROE conclusion, performance trend: a. Return on Equity improvement is due primarily to the improvement in Return on Assets. b. Return on Equity improvement is due primarily to the increase in financial Leverage. c. Return on Equity fell due primarily to the decline in Return on Assets d. Return on Equity fell due primarily to the reduction in financial Leverage. e. Return on Equity did not change compared to last year. Microsoft Corporation mere Gr Mer IN 4024 IN 100% UN NE COGS ROS 36.5% OT NI NE! N MGA OP VOH SEST NEW Opp ROK STT 1449 SS LAR VARTS 1.25 0.50 EN VINIRE 10 100 Det er der CA LEGEND Nem 10% 2014 This indicates how effectively the owners (shareholders) investment is being employed; the efficiency with which managers use the owners' equity investment to produce carnings, net income generated per $1.00 in oquity, Larger (positive) values are preferred. ROE and ROA differ only by the extent to which the firm is leveraged. Thus, any difference between ROE and ROA is a measure of the effect of the capital structure on the firm's performance. Alas, there is no free lunch: any increase in ROE performance due to leverage is off-set by the risk associated with leverage and thus, changes in capital structure tend to have no effect on the value of the firm. (Also known as 'ROE and Return on Net Worth) ROE Return on Equity (EBIAT) 0.0 43.2% 37.4% 200 30.196 100 11 14.4% 20.0% 10.0% 00 Plan 2021 2020 Industry QU. KUE conclusion, overall: a. the firm is more efficient in carning a profit on each dollar of Equity than the industry average, and is improving. b. the firm is more efficient in caring a profit on cach dollar of Equity than the industry average, but is declining. c. the firm is less efficient in carning a profit on cach dollar of Equity than the industry average, but is improving. d. the fire is less efficient in earning a profit on each dollar of Equity than the industry average, and is declining. Q31. ROE conclusion, performance relative to industry: 2. Return on Equity is better than the industry average performance due primarily to the superior Return on Assets. b. Return on Equity is better thun the industry average performance due primarily to higher financial Leverage c. Return on Equity is worse than the industry average performance duc primarily to the inferior Return on Assets. d. Return on Equity is worse than the industry average performance duc primarily to lower financial Leverage, e. Return on Equity is equal to the industry average. Q32. ROE conclusion, performance trend: a. Return on Equity improvement is due primarily to the improvement in Return on Assets. b. Return on Equity improvement is due primarily to the increase in financial Leverage. c. Return on Equity fell due primarily to the decline in Return on Assets d. Return on Equity fell due primarily to the reduction in financial Leverage. e. Return on Equity did not change compared to last year. Microsoft Corporation mere Gr Mer IN 4024 IN 100% UN NE COGS ROS 36.5% OT NI NE! N MGA OP VOH SEST NEW Opp ROK STT 1449 SS LAR VARTS 1.25 0.50 EN VINIRE 10 100 Det er der CA LEGEND Nem 10% 2014
Step by Step Solution
There are 3 Steps involved in it

Get step-by-step solutions from verified subject matter experts