

Question: Use Excel Add Trendline to fit the data from Problem 8.1 (Page 324) and answer the following questions: (Production Rate as X and Profit as
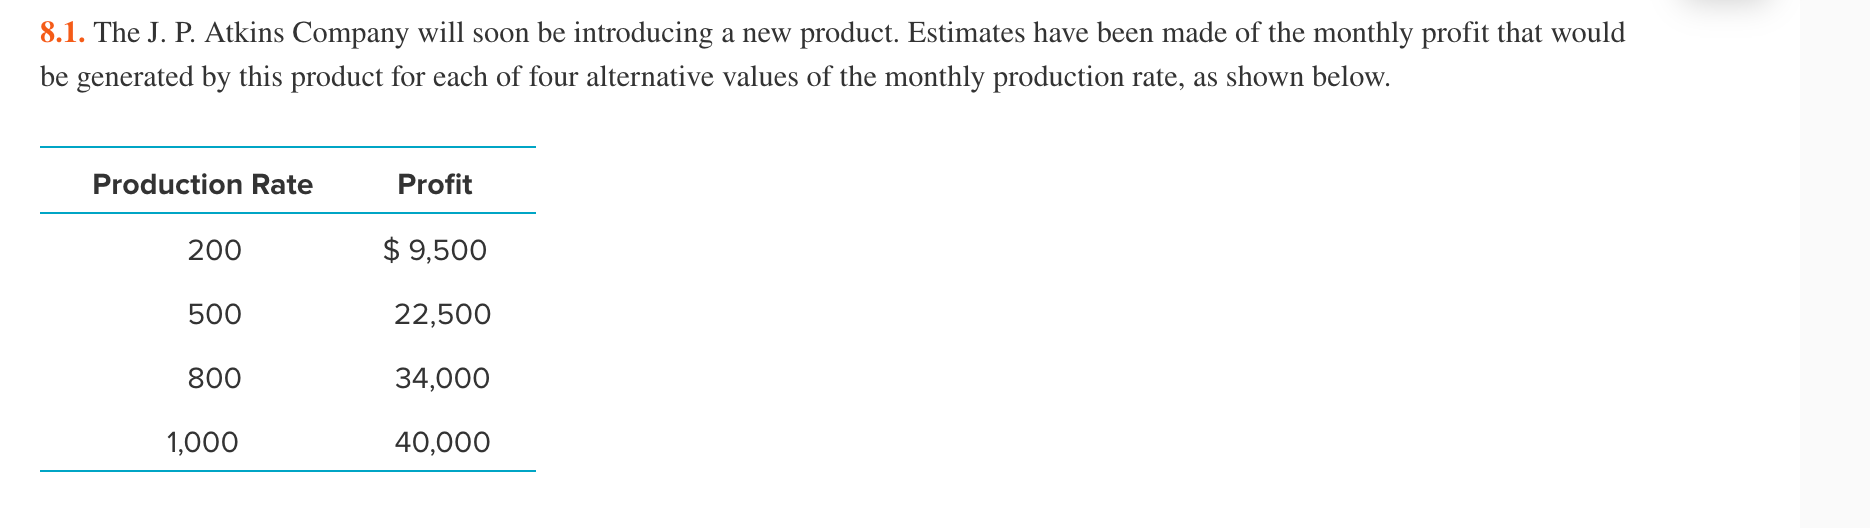
Use Excel "Add Trendline" to fit the data from Problem 8.1 (Page 324) and answer the following questions: (Production Rate as X and Profit as Y). This dataset has four observations of profit at four different production rate levels.
(a) Which of the following five functions produces the best fit, i.e. the highest R squre , for the data set (ignore the Moving average function): (Click to select) Exponential Linear Logarithmic Polynomial Power
(b) What is the Polynomial function with Order=2 generated by Trendline:
X2 + X + (Three decimal places. Some coefficients might be negative. In such case, just ener the negative value although it looks strange to have a "+" sign followed by a "-" sign.)
(c) What is the lowest R square produced by the five models: R2 = (four decimal places)
Step by Step Solution
There are 3 Steps involved in it

Get step-by-step solutions from verified subject matter experts