

Question: Use Excel and add excel formulas please. A product produced by ABC company consists of two successive operations, I and II. The table below contains
Use Excel and add excel formulas please.
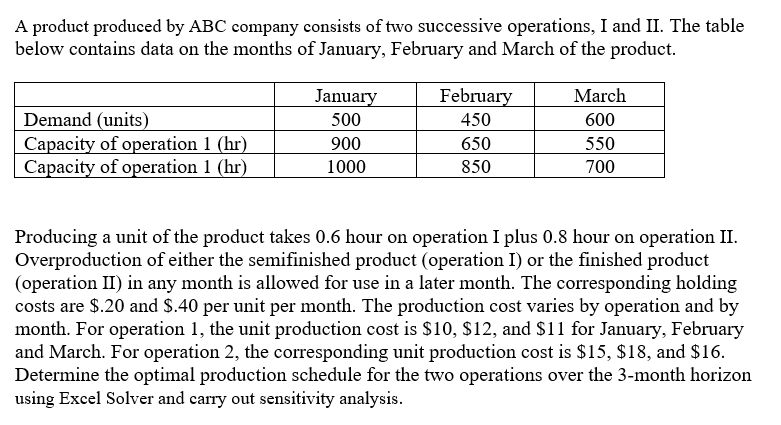
A product produced by ABC company consists of two successive operations, I and II. The table below contains data on the months of January, February and March of the product. Demand (units) Capacity of operation 1 (hr) Capacity of operation 1 (hr) January 500 900 1000 February 450 650 850 March 600 550 700 Producing a unit of the product takes 0.6 hour on operation I plus 0.8 hour on operation II. Overproduction of either the semifinished product (operation I) or the finished product (operation II) in any month is allowed for use in a later month. The corresponding holding costs are $.20 and $.40 per unit per month. The production cost varies by operation and by month. For operation 1, the unit production cost is $10, $12, and $11 for January, February and March. For operation 2, the corresponding unit production cost is $15, $18, and $16. Determine the optimal production schedule for the two operations over the 3-month horizon using Excel Solver and carry out sensitivity analysisStep by Step Solution
There are 3 Steps involved in it
1 Expert Approved Answer
Step: 1 Unlock

Question Has Been Solved by an Expert!
Get step-by-step solutions from verified subject matter experts
Step: 2 Unlock
Step: 3 Unlock