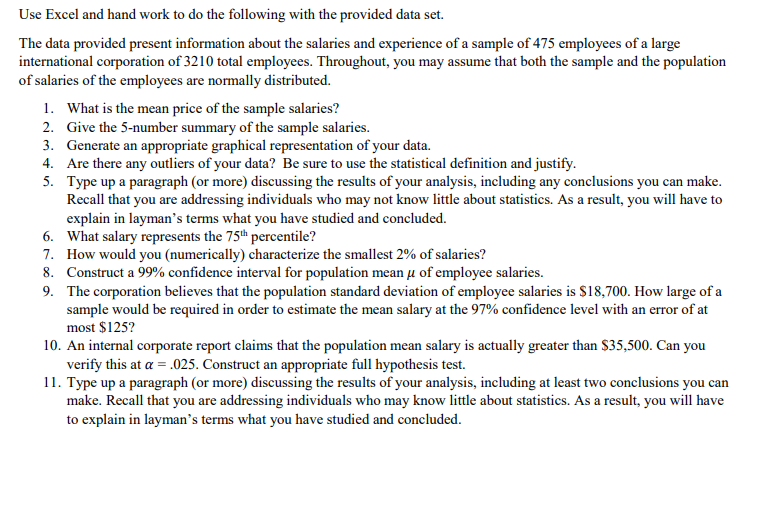
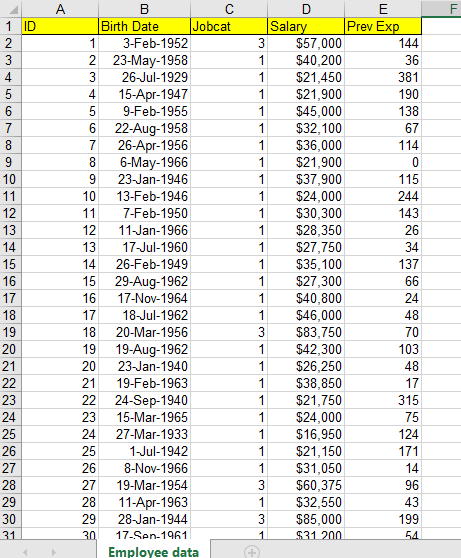
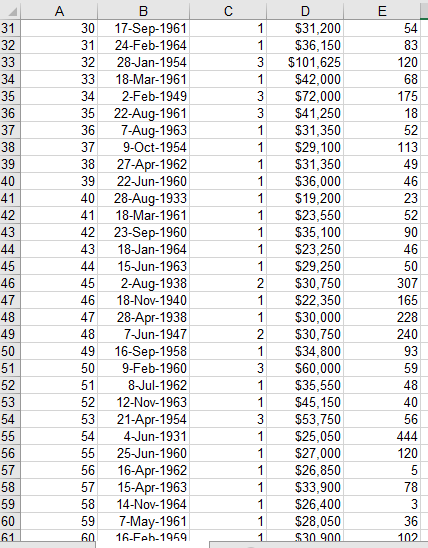
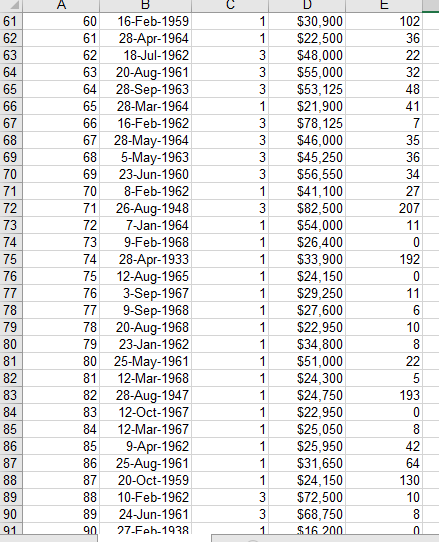
Use Excel and hand work to do the following with the provided data set. The data provided present information about the salaries and experience of a sample of 475 employees of a large international corporation of 3210 total employees. Throughout, you may assume that both the sample and the population of salaries of the employees are normally distributed. 1. What is the mean price of the sample salaries? 2. Give the 5-number summary of the sample salaries. 3. Generate an appropriate graphical representation of your data. 4. Are there any outliers of your data? Be sure to use the statistical definition and justify. 5. Type up a paragraph (or more) discussing the results of your analysis, including any conclusions you can make. Recall that you are addressing individuals who may not know little about statistics. As a result, you will have to explain in layman's terms what you have studied and concluded. 6. What salary represents the 75 percentile? 7. How would you (numerically) characterize the smallest 2% of salaries? 8. Construct a 99% confidence interval for population mean u of employee salaries. 9. The corporation believes that the population standard deviation of employee salaries is $18,700. How large of a sample would be required in order to estimate the mean salary at the 97% confidence level with an error of at most $125? 10. An internal corporate report claims that the population mean salary is actually greater than $35,500. Can you verify this at a = .025. Construct an appropriate full hypothesis test. 11. Type up a paragraph (or more) discussing the results of your analysis, including at least two conclusions you can make. Recall that you are addressing individuals who may know little about statistics. As a result, you will have to explain in layman's terms what you have studied and concluded. ID 1 2 3 4 5 6 7 8 9 10 11 12 13 14 15 16 17 18 19 20 21 22 23 24 25 26 27 28 29 30 31 B Birth Date Jobcat 1 3-Feb-1952 2 23-May-1958 3 26-Jul-1929 4 15-Apr-1947 5 9-Feb-1955 6 22-Aug-1958 7 26-Apr-1956 8 6-May-1966 9 23-Jan-1946 10 13-Feb-1946 11 7-Feb-1950 12 11-Jan-1966 13 17-Jul-1960 14 26-Feb-1949 15 29-Aug-1962 16 17-Nov-1964 17 18-Jul-1962 18 20-Mar-1956 19 19-Aug-1962 20 23-Jan-1940 21 19-Feb-1963 22 24-Sep-1940 23 15-Mar-1965 24 27-Mar-1933 25 1-Jul-1942 26 8-Nov-1966 27 19-Mar-1954 28 11-Apr-1963 29 28-Jan-1944 30 17-Sen-1961 Employee data E Salary Prev Exp 3 $57,000 144 1 $40,200 36 1 $21,450 381 1 $21,900 190 1 $45,000 138 1 $32,100 67 1 $36,000 114 1 $21,900 0 1 $37,900 115 1 $24,000 244 1 $30,300 143 1 $28,350 26 1 $27,750 34 1 $35,100 137 1 $27,300 66 1 $40,800 24 1 $46,000 48 3 $83,750 70 1 $42,300 103 1 $26,250 48 1 $38,850 17 1 $21,750 315 1 $24,000 75 1 $16,950 124 1 $21,150 171 1 $31,050 14 3 $60,375 96 1 $32,550 43 3 $85,000 199 1 $31 200 54 A E 31 32 33 34 35 36 37 38 39 40 41 42 43 44 45 46 47 48 49 50 51 52 53 54 55 56 57 58 59 60 61 B 30 17-Sep-1961 31 24-Feb-1964 32 28-Jan-1954 33 18-Mar-1961 34 2-Feb-1949 35 22-Aug-1961 36 7-Aug-1963 37 9-Oct-1954 38 27-Apr-1962 39 22-Jun-1960 40 28-Aug-1933 41 18-Mar-1961 42 23-Sep-1960 43 18-Jan-1964 44 15-Jun-1963 45 2-Aug-1938 46 18-Nov-1940 47 28-Apr-1938 48 7-Jun-1947 49 16-Sep-1958 50 9-Feb-1960 51 8-Jul-1962 52 12-Nov-1963 53 21-Apr-1954 54 4-Jun-1931 55 25-Jun-1960 56 16-Apr-1962 57 15-Apr-1963 58 14-Nov-1964 59 7-May-1961 60 16-Feb-1959 1 1 3 1 3 3 1 1 1 1 1 1 1 1 1 2 1 1 2 1 3 1 1 3 D $31,200 $36,150 $101,625 $42,000 $72,000 $41,250 $31,350 $29,100 $31,350 $36,000 $19,200 $23,550 $35, 100 $23,250 $29,250 $30,750 $22,350 $30,000 $30,750 $34,800 $60,000 $35,550 $45,150 $53,750 $25,050 $27,000 $26,850 $33,900 $26,400 $28,050 $30 900 54 83 120 68 175 18 52 113 49 46 23 52 90 46 50 307 165 228 240 93 59 48 40 56 444 120 1 1 1 1 1 1 78 3 36 102 E 1 3 3 61 62 63 64 65 66 67 68 69 70 71 72 73 74 75 76 77 78 79 80 81 1 3 3 3 3 1 3 1 B 60 16-Feb-1959 61 28-Apr-1964 62 18-Jul-1962 63 20-Aug-1961 64 28-Sep-1963 65 28-Mar-1964 66 16-Feb-1962 67 28-May-1964 68 5-May-1963 69 23-Jun-1960 70 8-Feb-1962 71 26-Aug-1948 72 7-Jan-1964 73 9-Feb-1968 74 28-Apr-1933 75 12-Aug-1965 76 3-Sep-1967 77 9-Sep-1968 78 20-Aug-1968 79 23-Jan-1962 80 25-May-1961 81 12-Mar-1968 82 28-Aug-1947 83 12-Oct-1967 84 12-Mar-1967 85 9-Apr-1962 86 25-Aug-1961 87 20-Oct-1959 88 10-Feb-1962 89 24-Jun-1961 90 27-Feb-1938 $30,900 $22,500 $48,000 $55,000 $53,125 $21,900 $78, 125 $46,000 $45,250 $56,550 $41,100 $82,500 $54,000 $26,400 $33,900 $24,150 $29,250 $27,600 $22,950 $34,800 $51,000 $24,300 $24,750 $22,950 $25,050 $25,950 $31,650 $24,150 $72,500 $68,750 $16.200 102 36 22 32 48 41 7 35 36 34 27 207 11 0 192 0 11 6 10 8 22 5 193 0 8 42 64 130 10 8 1 1 1 1 82 83 84 85 86 87 88 89 90 91 1 1 1 1 1 1 3 3 1 E 24 6 44 91 92 93 94 95 96 97 98 99 100 101 102 103 104 105 106 107 108 109 110 111 112 113 114 115 116 117 118 119 120 121 90 91 92 93 94 95 96 97 98 99 100 101 102 103 104 105 106 107 108 109 110 111 112 113 114 115 116 117 118 119 120 B 27-Feb-1938 4-Nov-1967 25-Jun-1968 5-Mar-1968 4-Aug-1950 8-Aug-1968 2-Oct-1933 18-Jan-1953 17-May-1956 7-Jul-1968 25-Oct-1963 14-Mar-1960 28-Mar-1963 17-Mar-1959 5-Nov-1962 7-Mar-1966 4-Aug-1962 16-Aug-1960 16-Jul-1930 10-Nov-1963 29-Oct-1952 27-Nov-1940 21-Jun-1948 6-Oct-1959 25-Aug-1961 12-May-1961 9-Jun-1962 14-Jan-1932 4-Mar-1964 23-Jul-1963 12-Nov-1964 1 1 1 1 1 1 2 1 2 1 3 3 1 3 1 1 3 1 1 1 1 2 2 3 1 1 1 1 1 1 3 D $16,200 $20,100 $24,000 $25,950 $24,600 $28,500 $30,750 $40,200 $30,000 $22,050 $78,250 $60,625 $39,900 $97,000 $27,450 $31,650 $91,250 $25,200 $21,000 $30,450 $28,350 $30,750 $30,750 $54,875 $37,800 $33,450 $30,300 $31,500 $31,650 $25,200 $37 800 432 168 144 5 47 44 59 68 48 18 23 83 108 49 151 314 240 68 60 85 16 205 48 55 7


