

Question: Use Excel and the attached data set to run a regression and make any necessary additional calculations to fill in the blank spaces. Use a
Use Excel and the attached data set to run a regression and make any necessary additional calculations to fill in the blank spaces. Use a 95% confidence level (.05 alpha) for all calculations requiring that information. Do not use any rounded values in any of your calculations. Round all your answers to 4 decimal places. Do not include any leading zeros in your responses for numbers that cannot be greater than 1. If the value is discrete, enter it as a whole number.
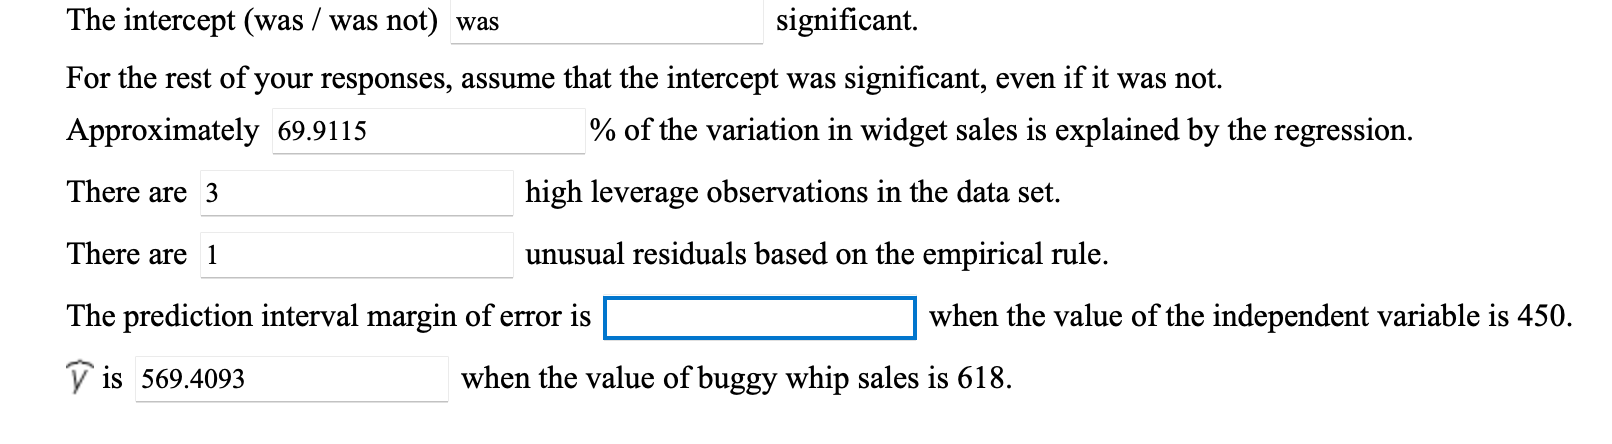
The intercept (was / was not) was signicant. For the rest of your responses, assume that the intercept was signicant, even if it was not. Approximately 69.9115 % of the variation in widget sales is explained by the regression. There are 3 high leverage observations in the data set. There are 1 unusual residuals based on the empirical rule. The prediction interval margin of error is |:| when the value of the independent variable is 450. V is 569.4093 when the value of buggy whip sales is 618
Step by Step Solution
There are 3 Steps involved in it

Get step-by-step solutions from verified subject matter experts