Question: Use Excel: Construct a n income statement for Harvest from the revenue streams and the costs that have been identified in the case. Assume a

Use Excel:
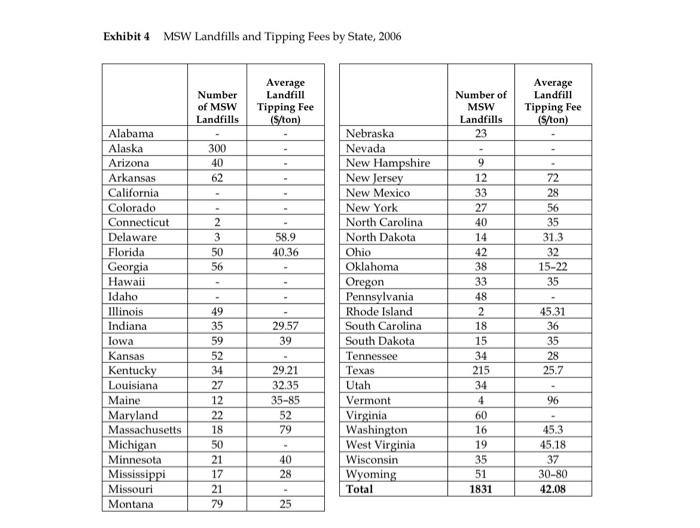
Construct an income statement for Harvest from the revenue streams and the costs that have been identified in the case. Assume a tip Fee of $50 per Ton. Assume a 40% benefit package for salaried personnel (1.4 x salary)

Follow this Income Statement format:

a. Revenue (per Ton)
b. Variable Cost (per Ton)
i. Revenues Costs per ton should give you a profit or a loss per ton
c. Fixed Costs (annual)
d. Depreciation (annual)
i. (For simplicity, for equipment/plant costs, use straight line depreciation for the life of the asset for the annual costs)
6. Using your data from Q#5 - Calculate the condition under which the business will be profitable - i.e. breakeven analysis how many tons must be processed to breakeven?
7. If the plant runs at full capacity, what is the estimated annual profit?
Use Excel: Construct a n income statement for
Harvest: Organic Waste Recycling with Energy Recovery (A) 611-033 Exhibit 2 U.S. MSW Management, 2008 Generation and recovery (through recycling, composting, and combustion) of materials in MSW Weight Recovery as Generated Weight Recovered Percent of Material (millions of tons) (millions of tons) Generation Paper and paperboard 77.42 42.94 55,5% Glass 12.15 2.81 23.1% Metals Steel 15.68 5.29 33.7% Aluminum 3.41 0.72 21.1% Other nonferrous metals 1.76 1.21 68.8% Total metals 20.85 7.22 34.6% Plastics 30.05 2.12 7.1% Rubber and leather 7.41 1.06 14.3% Textiles 12.37 1.89 15.3% Wood 16.39 1.58 9.6% Other materials 4.50 1.15 25.6% Total materials in products 181.14 60.77 33.5% Other wastes Food, other** 31.79 0.8 2.5% Yard trimmings 32.90 21.3 64.7% Miscellaneous inorganic wastes 3.78 Negligible Negligible Total other wastes 68.47 22.1 32.3% Total municipal solid waste 249.61 82.87 33.2% * Includes lead from lead acid batteries Includes recovery of other MSW organics for composting *** Less than 5,000 tons or 0.05% MSW Management Discarded 54.2% Recovery 33.2% Combustion with Energy Recovery 12.6% Exhibit 3 U.S. Waste Management Industry Statistics Historical and Projected Growth of the Waste Management Industry (in $ billions) Year 1991 1992 1994 1995 1996 1997 1998 1999 2000 2001 Revenues $27.0 $28.2 $29.4 $31.0 325 $33.9 $35.1 $36.6 538.0 $39.4 540.8 1993 Year 2002 2003 2004 2005 2006 2007 2008 2009 2010 2011 2012 2013 Revenues $41.9 $42.9 $46.3 $49.8 $52.1 $54.0 $55.7 $57.4 $59.2 $60.9 $62.6 $64.2 Existing and Projected Solid Waste Market by Participant and Year (in S billions) Large Midsize Small Very Large ($100-999 ($20-$100 ($0.025-$20 (>$1 billion) million) million) million) Municipalities 2007 $25.2 $10.4 $3.4 $2.1 $12.9 2008 $30.0 $7.4 $3.5 $2.1 $12.8 2009 $31.1 $7.9 $3.7 $2.0 $12.7 2010 $324 $8.5 $3.8 $2.0 $12.6 2011 $33.6 $8.8 $4.1 $1.9 $12.5 2012 $34.7 $9.4 $4.3 $1.9 $12.4 2013 $35.8 $9.7 $4.5 $1.9 $12.3 Total $54.0 $55.8 $57.4 $59.3 $60.9 $62.7 $64.2 Industry Revenues by Participant and Type of Activity, 2008 (in S billions) Public Private/ Companies Small Municipal Total Collection Residential Collection 11.38 3.56 3.2 18.14 Commercial/Industrial Collection 7.79 2.42 2.17 12.38 Total Collection $19.17 $5.98 $5.37 $30.52 Processing Transfer 2.45 0.85 1.67 4.97 MRF / Recycling Operations 0.77 0.5 1.60 Composting 0.05 0.06 0.05 0.16 Total Processing $3.27 $1.41 $2.06 $6.73 Disposal Incineration/Waste-to-energy 1.14 0.68 0.99 2.81 Landfill Operations 9.56 1.71 4.38 15.65 Total Disposal $10.70 $2.39 $5.37 $18.46 Total Market $33.14 $9.78 $12.80 $55.71 0.33 Exhibit 4 MSW Landfills and Tipping Fees by State, 2006 Number of MSW Landfills Average Landfill Tipping Fee (S/ton) Number of MSW Landfills 23 Average Landfill Tipping Fee (S/ton) 300 40 62 2 3 50 56 72 28 56 35 31.3 32 15-22 35 58.9 40.36 Alabama Alaska Arizona Arkansas California Colorado Connecticut Delaware Florida Georgia Hawaii Idaho Illinois Indiana lowa Kansas Kentucky Louisiana Maine Maryland Massachusetts Michigan Minnesota Mississippi Missouri Montana Nebraska Nevada New Hampshire New Jersey New Mexico New York North Carolina North Dakota Ohio Oklahoma Oregon Pennsylvania Rhode Island South Carolina South Dakota Tennessee Texas Utah Vermont Virginia Washington West Virginia Wisconsin Wyoming Total 29.57 39 9 12 33 27 40 14 42 38 33 48 2 18 15 34 215 34 4 60 16 19 35 51 1831 49 35 59 52 34 27 12 22 18 50 21 17 21 79 45.31 36 35 28 25.7 29.21 32.35 35-85 52 79 96 40 28 45.3 45.18 37 30-80 42.08 25

Step by Step Solution

There are 3 Steps involved in it

1 Expert Approved Answer
Step: 1 Unlock blur-text-image
Question Has Been Solved by an Expert!

Get step-by-step solutions from verified subject matter experts

Step: 2 Unlock
Step: 3 Unlock

Students Have Also Explored These Related General Management Questions!