

Question: use excel Excel File Edit Window Help * a 8 Mon Apr 25 12:58 PM View Insert Format Tools Data NO2C nece... AutoSave OFF 2
 use excel
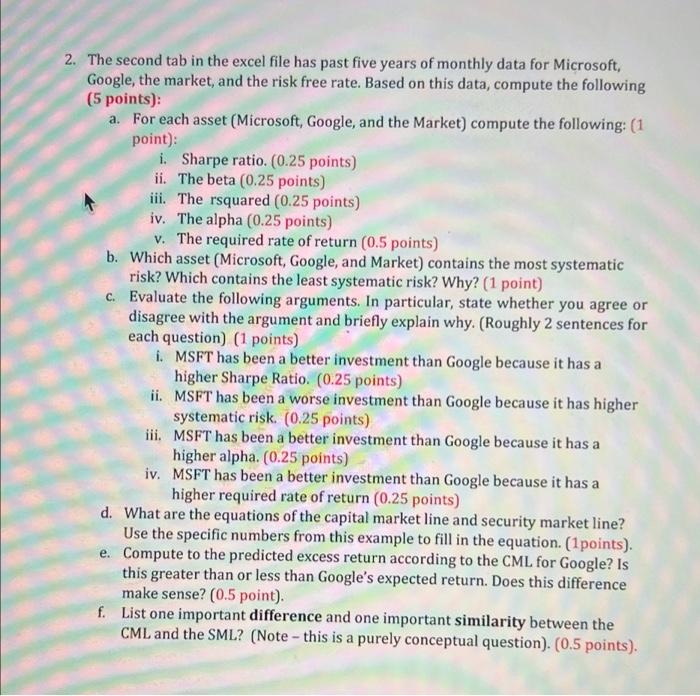
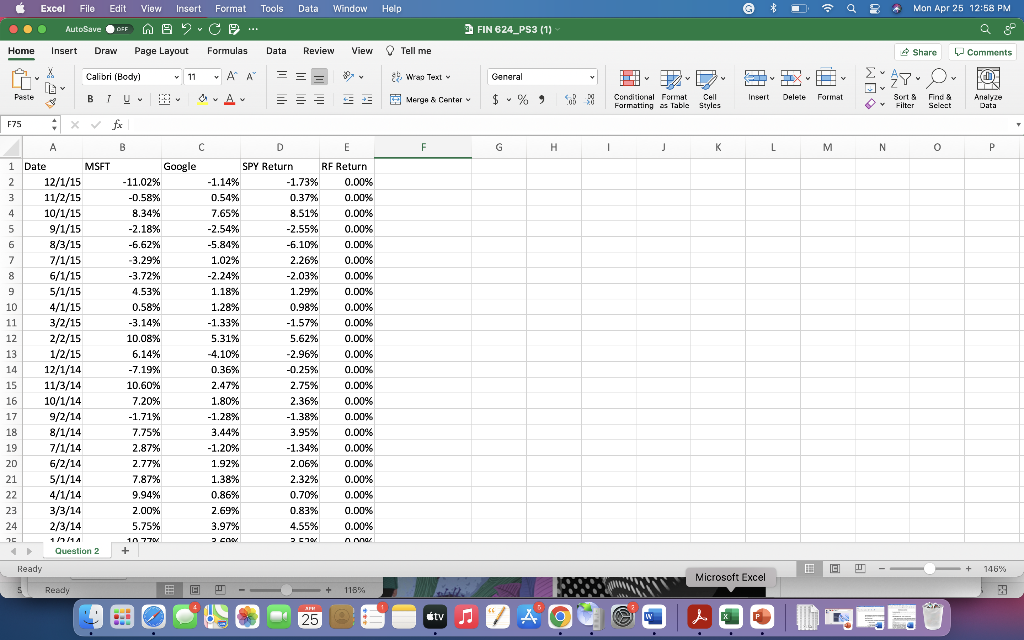
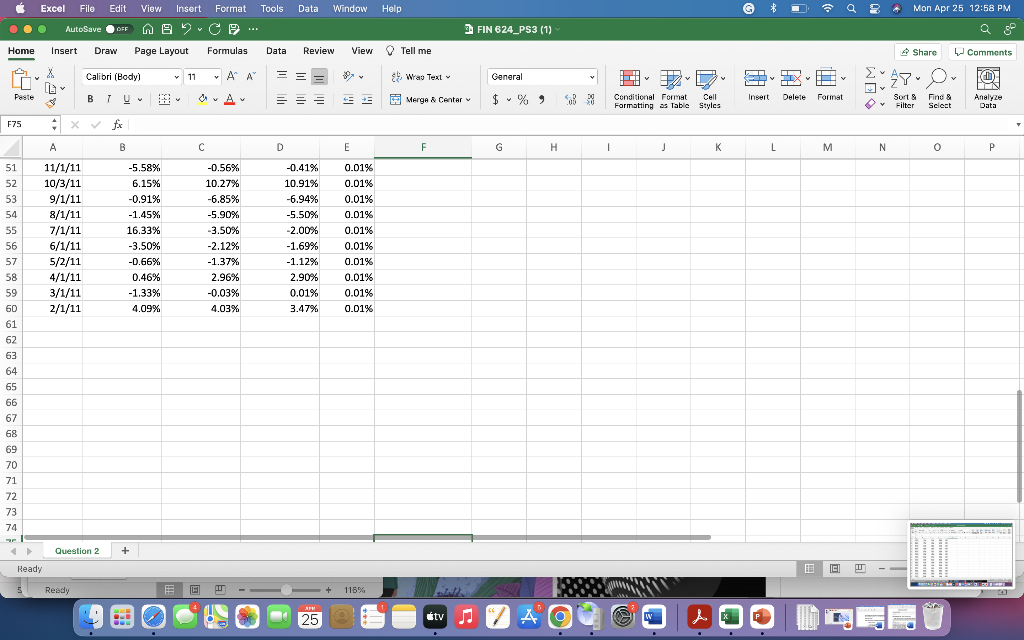
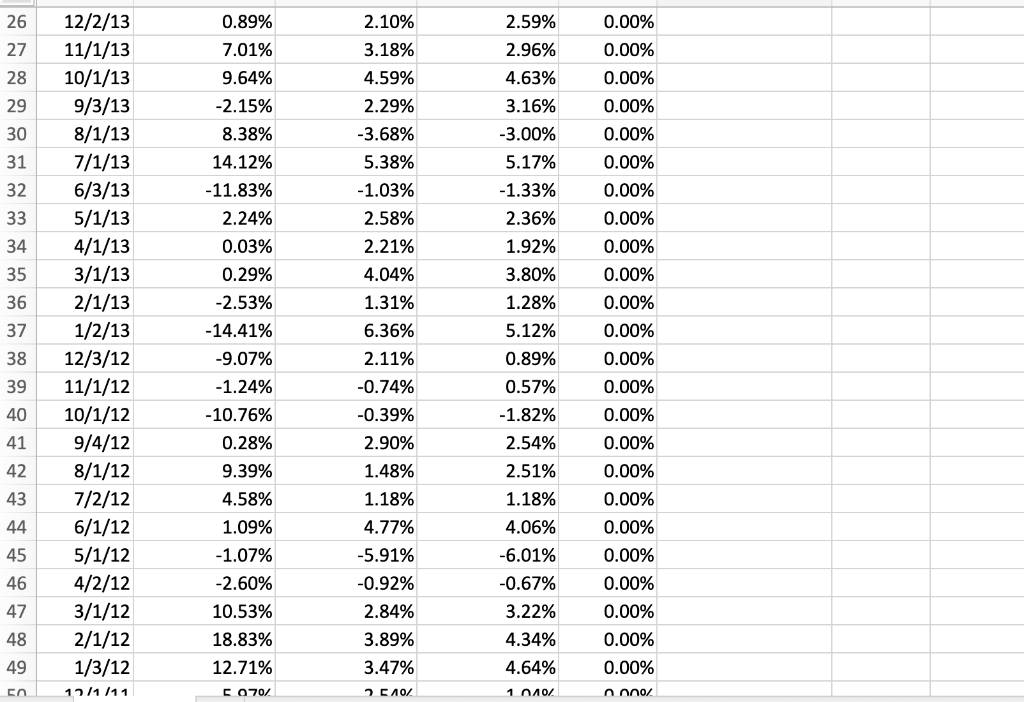
Excel File Edit Window Help * a 8 Mon Apr 25 12:58 PM View Insert Format Tools Data NO2C nece... AutoSave OFF 2 FIN 624_PS3 (1) Home Insert Draw Page Layout Formulas Data Review View Tell me Share W Comments Calibri (Body) v 11 A AA v = Oy & Wrap Text s9 General IX WIE Y O. Peste B TU U 11 OA 3 A = - + Merge Center $ %, Insert Conditional Format Cell Formatting as Table Styles Delete Format Sort Filter Find & Sclect Analyze Data F75 xv fx A B C D E F G H 1 K L M M N O 0 P 1 Date MSET 2 12/1/15 3 11/2/15 4 10/1/15 5 9/1/15 6 8/3/15 7 7/1/15 8 6/1/15 . 9 5/1/15 10 4/1/15 11 3/2/15 12 2/2/15 151 13 1/2/15 121111 14 15 11/3/14 16 10/1/14 17 9/2/14 18 10 8/1/14 19 19 7/1/14 20 6/2/14 21 5/1/14 22 4/1/14 23 3/3/14 24 2/3/14 1/11 Question 2 Google -11.02% -0.58% 8.34% -2.18% Sad -6.62% -3.29% -3.72% 4.53% 0.58% -3.14% 10.08% 40 6.14% 210 -7.19% 1.COM 10.60% 7.20% -1.71% 7.75% 2.87% 2.77% 7.87% 9.94% SPY Return RF Return -1.14% -1.73% 0.00% 0.54% 0.37% 0.00% 7.65% 8.51% 0.00% wer -2.54% -2.55% 0.00% wome -5.84% -6.10% 0.00% 1.02% 2.26% 0.00% -2.24% -2.03% 0.00% 1.18% 1.29% 0.00% 1.28% 0.98% 0.00% -1.33% -1.57% 0.00% 5.31% 5.62% 0.00% A -4.10% -2.96% 0.00% co 0.36% -0.25% 0.00% 2.47% 27 2.75% 0.00% 1.80% 1 Box % 2.36% 0.00% -1.28% %. -1.38% 0.00% 3.44% % 3.95% -1.20% -1.34% 0.00% 1.92% 2.06% 0.00% 1.38% 2.32% 0.00% 0.86% 0.70% 0.00% 2.69% 0.83% 0.00% 3.97% 4.55% 0.00% 5 co Anna 0.007 2.00% 5.75% 10 770 + w Ready HE I - + 146% Microsoft Excel 5 Ready IF 116% SFH 25 tv o W P Excel File Edit Window Help a 8 + Mon Apr 25 12:58 PM View Insert Format Tools Data NO2C nece... AutoSave OFF 2 FIN 624_PS3 (1) Home Insert Draw Page Layout Formulas Data Review View Tell me Share W Comments Calibri (Body) v 11 > AA . = Oy s9 Wao Text General O. Peste B 12 = + 3 $ %, Merge & Center Insert Format Conditional Format Cell Formatting as Table Styles Delete Sort Filter Find & Select Analyze Data F75 . x fx A B D E F G H 1 K K L M N 0 0 P 51 52 53 11/1/11 10/3/11 9/1/11 8/1/11 7/1/11 11 6/1/11 5/2/11 4/1/11 3/1/11 2/1/11 -5.58% 6.15% -0.91% -1.45% 16.33% -3,50% -0.66% 0.46% -1.33% 4.09% -0.56% 10.27% 0.85% -6.85% -5.90% wiece -3.50% wer -2.12% -1.37% 2.96% -0.03% 4.03% -0.41% 10.91% -6.94% -5.50% wieder -2.00% -1.69% -1.12% 2.90% 0.01% 3.47% 0.01% 0.01% 0.01% 0.017 0.01% ware 0.01% 0.01% 0.01% 0.01% 0.01% 0.01% 54 55 56 57 58 59 60 61 62 63 64 65 66 67 co 68 69 70 71 72 73 74 SHIRE Question 2 + Ready 5 Ready FI WT -- 115% SFH 25 tv A o W L 2.10% 26 27 28 3.18% 0.00% 0.00% 0.00% 4.59% 29 0.00% 0.00% 30 31 32 33 0.89% 7.01% 9.64% -2.15% 8.38% 14.12% -11.83% 2.24% 0.03% 0.29% -2.53% -14.41% -9.07% - 1.24% -10.76% 0.28% 2.29% -3.68% 5.38% -1.03% 2.58% 2.21% 4.04% 1.31% 2.59% 2.96% 4.63% 3.16% -3.00% 5.17% -1.33% 2.36% 1.92% 3.80% 1.28% 5.12% 0.89% 0.57% -1.82% 2.54% 34 35 36 37 12/2/13 11/1/13 10/1/13 9/3/13 8/1/13 7/1/13 6/3/13 5/1/13 4/1/13 3/1/13 2/1/13 1/2/13 12/3/12 11/1/12 10/1/12 9/4/12 8/1/12 7/2/12 6/1/12 5/1/12 4/2/12 3/1/12 2/1/12 1/3/12 17/1/11 0.00% 0.00% 0.00% 0.00% 0.00% 0.00% 0.00% 0.00% 0.00% 0.00% 0.00% 6.36% 38 39 40 41 0.00% 42 43 9.39% 4.58% 1.09% 2.11% -0.74% -0.39% 2.90% 1.48% 1.18% 4.77% -5.91% -0.92% 2.84% 3.89% 3.47% 2.51% 1.18% 4.06% 44 45 -1.07% 46 47 0.00% 0.00% 0.00% 0.00% 0.00% 0.00% 0.00% -6.01% -0.67% 3.22% 4.34% 4.64% 1 -2.60% 10.53% 18.83% 12.71% 48 49 2. The second tab in the excel file has past five years of monthly data for Microsoft, Google, the market, and the risk free rate. Based on this data, compute the following (5 points) a. For each asset (Microsoft, Google, and the Market) compute the following: (1 point): i. Sharpe ratio. (0.25 points) ii. The beta (0.25 points) iii. The rsquared (0.25 points) iv. The alpha (0.25 points) V. The required rate of return (0.5 points) b. Which asset (Microsoft, Google, and Market) contains the most systematic risk? Which contains the least systematic risk? Why? (1 point) c. Evaluate the following arguments. In particular, state whether you agree or disagree with the argument and briefly explain why. (Roughly 2 sentences for each question) (1 points) i. MSFT has been a better investment than Google because it has a higher Sharpe Ratio. (0.25 points) ii. MSFT has been a worse investment than Google because it has higher systematic risk. (0.25 points) iii. MSFT has been a better investment than Google because it has a higher alpha. (0.25 points) iv. MSFT has been a better investment than Google because it has a higher required rate of return (0.25 points) d. What are the equations of the capital market line and security market line? Use the specific numbers from this example to fill in the equation. (1points). e. Compute to the predicted excess return according to the CML for Google? Is this greater than or less than Google's expected return. Does this difference make sense? (0.5 point). f. List one important difference and one important similarity between the CML and the SML? (Note - this is a purely conceptual question) (0.5 points). Excel File Edit Window Help * a 8 Mon Apr 25 12:58 PM View Insert Format Tools Data NO2C nece... AutoSave OFF 2 FIN 624_PS3 (1) Home Insert Draw Page Layout Formulas Data Review View Tell me Share W Comments Calibri (Body) v 11 A AA v = Oy & Wrap Text s9 General IX WIE Y O. Peste B TU U 11 OA 3 A = - + Merge Center $ %, Insert Conditional Format Cell Formatting as Table Styles Delete Format Sort Filter Find & Sclect Analyze Data F75 xv fx A B C D E F G H 1 K L M M N O 0 P 1 Date MSET 2 12/1/15 3 11/2/15 4 10/1/15 5 9/1/15 6 8/3/15 7 7/1/15 8 6/1/15 . 9 5/1/15 10 4/1/15 11 3/2/15 12 2/2/15 151 13 1/2/15 121111 14 15 11/3/14 16 10/1/14 17 9/2/14 18 10 8/1/14 19 19 7/1/14 20 6/2/14 21 5/1/14 22 4/1/14 23 3/3/14 24 2/3/14 1/11 Question 2 Google -11.02% -0.58% 8.34% -2.18% Sad -6.62% -3.29% -3.72% 4.53% 0.58% -3.14% 10.08% 40 6.14% 210 -7.19% 1.COM 10.60% 7.20% -1.71% 7.75% 2.87% 2.77% 7.87% 9.94% SPY Return RF Return -1.14% -1.73% 0.00% 0.54% 0.37% 0.00% 7.65% 8.51% 0.00% wer -2.54% -2.55% 0.00% wome -5.84% -6.10% 0.00% 1.02% 2.26% 0.00% -2.24% -2.03% 0.00% 1.18% 1.29% 0.00% 1.28% 0.98% 0.00% -1.33% -1.57% 0.00% 5.31% 5.62% 0.00% A -4.10% -2.96% 0.00% co 0.36% -0.25% 0.00% 2.47% 27 2.75% 0.00% 1.80% 1 Box % 2.36% 0.00% -1.28% %. -1.38% 0.00% 3.44% % 3.95% -1.20% -1.34% 0.00% 1.92% 2.06% 0.00% 1.38% 2.32% 0.00% 0.86% 0.70% 0.00% 2.69% 0.83% 0.00% 3.97% 4.55% 0.00% 5 co Anna 0.007 2.00% 5.75% 10 770 + w Ready HE I - + 146% Microsoft Excel 5 Ready IF 116% SFH 25 tv o W P Excel File Edit Window Help a 8 + Mon Apr 25 12:58 PM View Insert Format Tools Data NO2C nece... AutoSave OFF 2 FIN 624_PS3 (1) Home Insert Draw Page Layout Formulas Data Review View Tell me Share W Comments Calibri (Body) v 11 > AA . = Oy s9 Wao Text General O. Peste B 12 = + 3 $ %, Merge & Center Insert Format Conditional Format Cell Formatting as Table Styles Delete Sort Filter Find & Select Analyze Data F75 . x fx A B D E F G H 1 K K L M N 0 0 P 51 52 53 11/1/11 10/3/11 9/1/11 8/1/11 7/1/11 11 6/1/11 5/2/11 4/1/11 3/1/11 2/1/11 -5.58% 6.15% -0.91% -1.45% 16.33% -3,50% -0.66% 0.46% -1.33% 4.09% -0.56% 10.27% 0.85% -6.85% -5.90% wiece -3.50% wer -2.12% -1.37% 2.96% -0.03% 4.03% -0.41% 10.91% -6.94% -5.50% wieder -2.00% -1.69% -1.12% 2.90% 0.01% 3.47% 0.01% 0.01% 0.01% 0.017 0.01% ware 0.01% 0.01% 0.01% 0.01% 0.01% 0.01% 54 55 56 57 58 59 60 61 62 63 64 65 66 67 co 68 69 70 71 72 73 74 SHIRE Question 2 + Ready 5 Ready FI WT -- 115% SFH 25 tv A o W L 2.10% 26 27 28 3.18% 0.00% 0.00% 0.00% 4.59% 29 0.00% 0.00% 30 31 32 33 0.89% 7.01% 9.64% -2.15% 8.38% 14.12% -11.83% 2.24% 0.03% 0.29% -2.53% -14.41% -9.07% - 1.24% -10.76% 0.28% 2.29% -3.68% 5.38% -1.03% 2.58% 2.21% 4.04% 1.31% 2.59% 2.96% 4.63% 3.16% -3.00% 5.17% -1.33% 2.36% 1.92% 3.80% 1.28% 5.12% 0.89% 0.57% -1.82% 2.54% 34 35 36 37 12/2/13 11/1/13 10/1/13 9/3/13 8/1/13 7/1/13 6/3/13 5/1/13 4/1/13 3/1/13 2/1/13 1/2/13 12/3/12 11/1/12 10/1/12 9/4/12 8/1/12 7/2/12 6/1/12 5/1/12 4/2/12 3/1/12 2/1/12 1/3/12 17/1/11 0.00% 0.00% 0.00% 0.00% 0.00% 0.00% 0.00% 0.00% 0.00% 0.00% 0.00% 6.36% 38 39 40 41 0.00% 42 43 9.39% 4.58% 1.09% 2.11% -0.74% -0.39% 2.90% 1.48% 1.18% 4.77% -5.91% -0.92% 2.84% 3.89% 3.47% 2.51% 1.18% 4.06% 44 45 -1.07% 46 47 0.00% 0.00% 0.00% 0.00% 0.00% 0.00% 0.00% -6.01% -0.67% 3.22% 4.34% 4.64% 1 -2.60% 10.53% 18.83% 12.71% 48 49 2. The second tab in the excel file has past five years of monthly data for Microsoft, Google, the market, and the risk free rate. Based on this data, compute the following (5 points) a. For each asset (Microsoft, Google, and the Market) compute the following: (1 point): i. Sharpe ratio. (0.25 points) ii. The beta (0.25 points) iii. The rsquared (0.25 points) iv. The alpha (0.25 points) V. The required rate of return (0.5 points) b. Which asset (Microsoft, Google, and Market) contains the most systematic risk? Which contains the least systematic risk? Why? (1 point) c. Evaluate the following arguments. In particular, state whether you agree or disagree with the argument and briefly explain why. (Roughly 2 sentences for each question) (1 points) i. MSFT has been a better investment than Google because it has a higher Sharpe Ratio. (0.25 points) ii. MSFT has been a worse investment than Google because it has higher systematic risk. (0.25 points) iii. MSFT has been a better investment than Google because it has a higher alpha. (0.25 points) iv. MSFT has been a better investment than Google because it has a higher required rate of return (0.25 points) d. What are the equations of the capital market line and security market line? Use the specific numbers from this example to fill in the equation. (1points). e. Compute to the predicted excess return according to the CML for Google? Is this greater than or less than Google's expected return. Does this difference make sense? (0.5 point). f. List one important difference and one important similarity between the CML and the SML? (Note - this is a purely conceptual question) (0.5 points)
Step by Step Solution
There are 3 Steps involved in it

Get step-by-step solutions from verified subject matter experts