

Question: Use Excel functions to answer the question, show the steps 4. (a) Refer to the table below. Work out the Price Earnings Ratios ofthe five
Use Excel functions to answer the question, show the steps
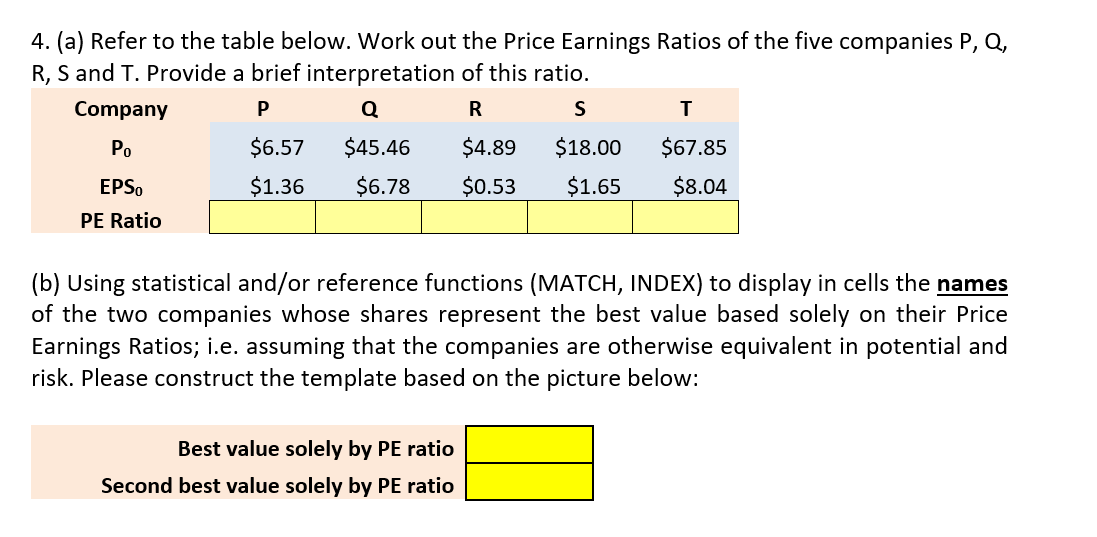
4. (a) Refer to the table below. Work out the Price Earnings Ratios ofthe five companies P, Q, R, S and T. Provide a brief interpretation of this ratio. Company P Q R S T Pu $6.57 $45.46 $4.39 $18.00 $67.35 EPSo $1.36 $6.73 $0.53 $1.65 $8.04 PE Ratio l (b) Using statistical and/or reference functions (MATCH, INDEX) to display in cells the names of the two companies whose shares represent the best value based solely on their Price Earnings Ratios; i.e. assuming that the companies are otherwise equivalent in potential and risk. Please construct the template based on the picture below: Best value solely by PE ratio Second best value solely by PE ratio
Step by Step Solution
There are 3 Steps involved in it

Get step-by-step solutions from verified subject matter experts