

Question: 4. (a) Refer to the table below. Work out the Price Earnings Ratios of the five companies P, Q, R, S and T. Provide a
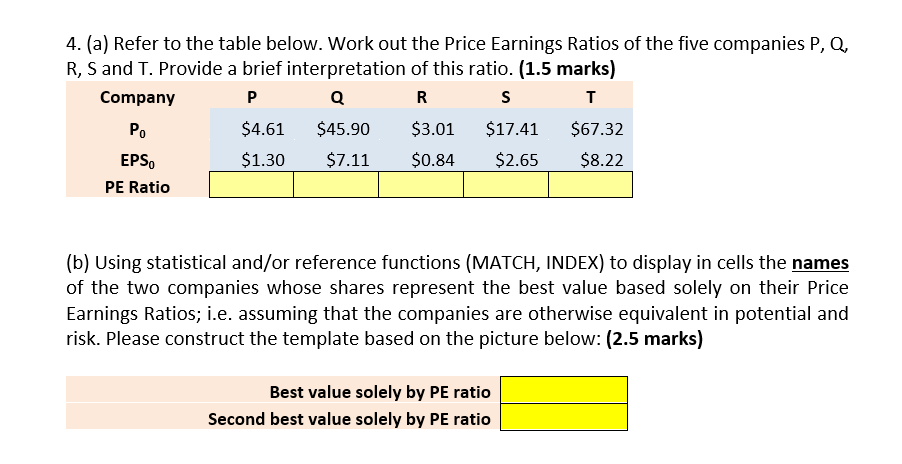
4. (a) Refer to the table below. Work out the Price Earnings Ratios of the five companies P, Q, R, S and T. Provide a brief interpretation of this ratio. (1.5 marks) Company Q R S P. $4.61 $45.90 $3.01 $17.41 $67.32 EPS, $1.30 $7.11 $0.84 $2.65 $8.22 PE Ratio (b) Using statistical and/or reference functions (MATCH, INDEX) to display in cells the names of the two companies whose shares represent the best value based solely on their Price Earnings Ratios; i.e. assuming that the companies are otherwise equivalent in potential and risk. Please construct the template based on the picture below: (2.5 marks) Best value solely by PE ratio Second best value solely by PE ratio
Step by Step Solution
There are 3 Steps involved in it

Get step-by-step solutions from verified subject matter experts