

Question: Q2. An economist is interested in the relationship between the disposable income of a family and the amount of money spent annually on food.
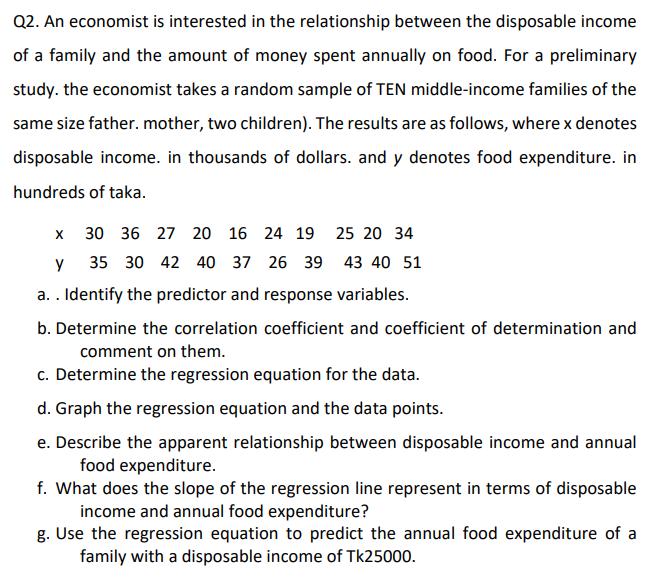
Q2. An economist is interested in the relationship between the disposable income of a family and the amount of money spent annually on food. For a preliminary study. the economist takes a random sample of TEN middle-income families of the same size father. mother, two children). The results are as follows, where x denotes disposable income. in thousands of dollars. and y denotes food expenditure. in hundreds of taka. 30 36 27 20 16 24 19 25 20 34 35 30 42 40 37 26 39 43 40 51 a. . Identify the predictor and response variables. b. Determine the correlation coefficient and coefficient of determination and comment on them. c. Determine the regression equation for the data. d. Graph the regression equation and the data points. e. Describe the apparent relationship between disposable income and annual food expenditure. f. What does the slope of the regression line represent in terms of disposable income and annual food expenditure? g. Use the regression equation to predict the annual food expenditure of a family with a disposable income of Tk25000.
Step by Step Solution
3.50 Rating (147 Votes )
There are 3 Steps involved in it
A identify the predictor and response variables The outcome or dependent variable is known as the response variable while the risk factors and confoun... View full answer

Get step-by-step solutions from verified subject matter experts