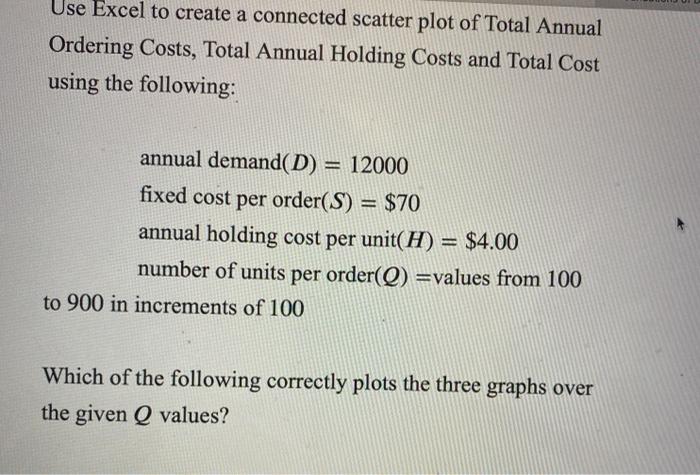
Question: Use Excel to create a connected scatter plot of Total Annual Ordering Costs, Total Annual Holding Costs and Total Cost using the following: annual demand(D)

Use Excel to create a connected scatter plot of
Use Excel to create a connected scatter plot of Total Annual Ordering Costs, Total Annual Holding Costs and Total Cost using the following: annual demand(D) = 12000 fixed cost per order(S) = $70 annual holding cost per unit(H) = $4.00 number of units per order(Q) =values from 100 to 900 in increments of 100 Which of the following correctly plots the three graphs over the given Q values? 3000 2500 O 2000 a) 1500 1000 Total Annual Ordering Costs Total Annual Holding Custs Total Cost 500 0 0 200 400 600 BOO 1000 6000 5000 b) 4000 3000 Total Annual Ordering Costs Total Annual Holding Costs - Total Cost 2000 1000 0 200 400 600 800 1000 6000 5000 4000 c) 3000 Total Annual Ordering Costs Total Annual Holding Costs Total Cost 2000 1000 200 400 600 800 1000 3000 2500 2000 d) 1500 Total Annual Ordering Costs Total Annual Holding Costs Total Cost 1000 500 O 200 400 600 800 1000

Step by Step Solution

There are 3 Steps involved in it

1 Expert Approved Answer
Step: 1 Unlock blur-text-image
Question Has Been Solved by an Expert!

Get step-by-step solutions from verified subject matter experts

Step: 2 Unlock
Step: 3 Unlock

Students Have Also Explored These Related General Management Questions!