

Question: Use Excel to create a plot of hydrostatic pore pressure in kPa ( x - axis ) vs . depth in meters ( y -
Use Excel to create a plot of hydrostatic pore pressure in kPa xaxis vs depth in meters yaxis for the profile in attached picture. We shall assume that the soil above the water table is dry, so clearly, the uh from z to z m and uh from z m to z m Graph format same as that in page : line only no markers; yaxis in reverse order, starting with z and ending with z m Label both axes and add tick marks to them. Remember: use an xy scatter graph type in Excel. Gradation
Recall that the fabric and therefore the mechanical behavior of coarse soils depends strongly on the range of grain sizes that a soil possesses. This range is called gradation.
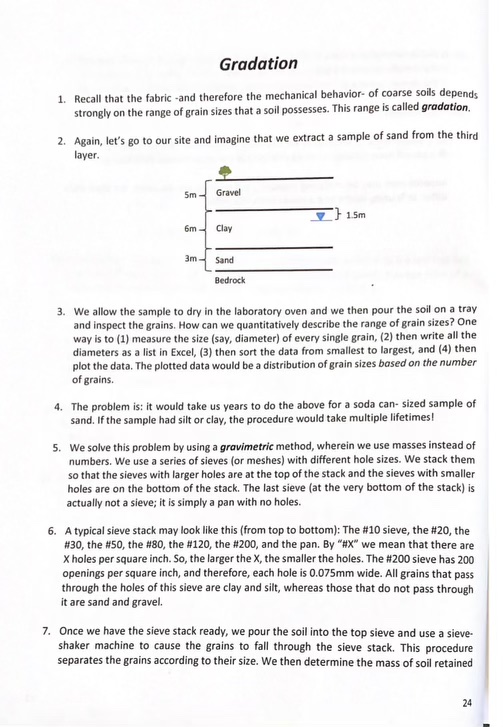
Again, let's go to our site and imagine that we extract a sample of sand from the third layer.
We allow the sample to dry in the laboratory oven and we then pour the soil on a tray and inspect the grains. How can we quantitatively describe the range of grain sizes? One way is to measure the size say diameter of every single grain, then write all the diameters as a list in Excel, then sort the data from smallest to largest, and then plot the data. The plotted data would be a distribution of grain sizes based on the number of grains.
The problem is: it would take us years to do the above for a soda can sized sample of sand. If the sample had silt or clay, the procedure would take multiple lifetimes!
We solve this problem by using a gravimetric method, wherein we use masses instead of numbers. We use a series of sieves or meshes with different hole sizes. We stack them so that the sieves with larger holes are at the top of the stack and the sieves with smaller holes are on the bottom of the stack. The last sieve at the very bottom of the stack is actually not a sieve; it is simply a pan with no holes.
A typical sieve stack may look like this from top to bottom: The # sieve, the # the # the # the # the # the # and the pan. By #X we mean that there are X holes per square inch. So the larger the X the smaller the holes. The # sieve has openings per square inch, and therefore, each hole is mm wide. All grains that pass through the holes of this sieve are clay and silt, whereas those that do not pass through it are sand and gravel.
Once we have the sieve stack ready, we pour the soil into the top sieve and use a sieveshaker machine to cause the grains to fall through the sieve stack. This procedure separates the grains according to their size. We then determine the mass of soil retained
Step by Step Solution
There are 3 Steps involved in it
1 Expert Approved Answer
Step: 1 Unlock

Question Has Been Solved by an Expert!
Get step-by-step solutions from verified subject matter experts
Step: 2 Unlock
Step: 3 Unlock